Market Overview
| Study Period | 2021 - 2031 |
|---|---|
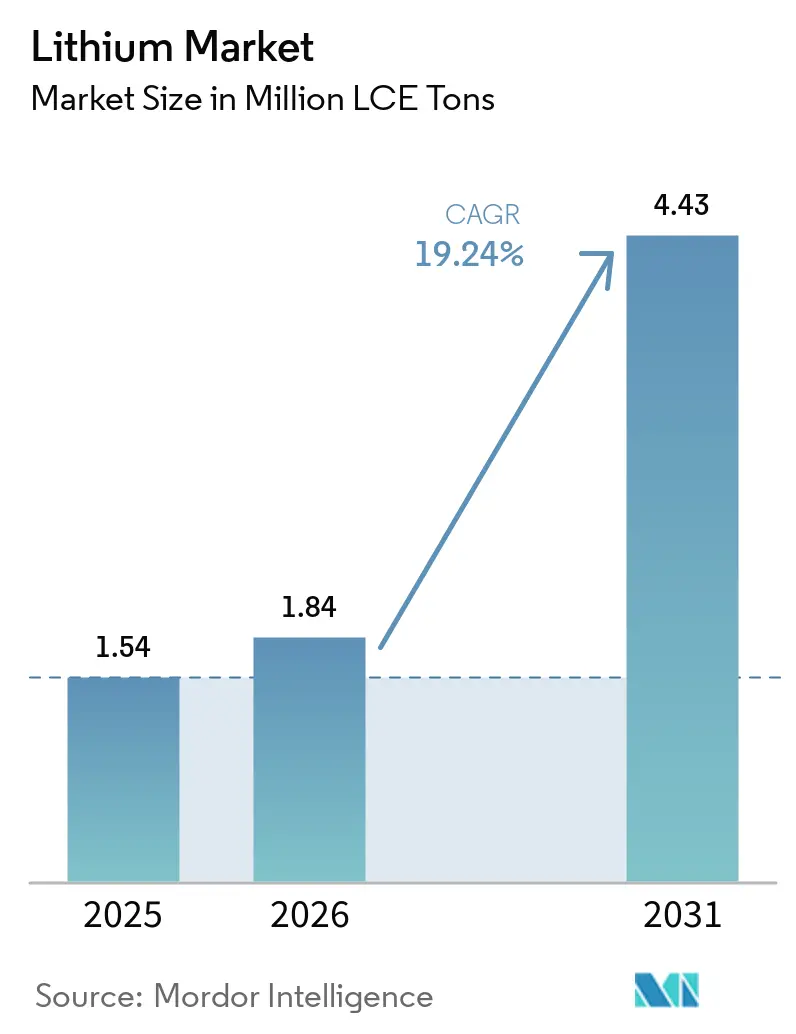
| Market Volume (2026) | 1.84 Million LCE tons |
| Market Volume (2031) | 4.43 Million LCE tons |
| Growth Rate (2026 - 2031) | 19.24% CAGR |
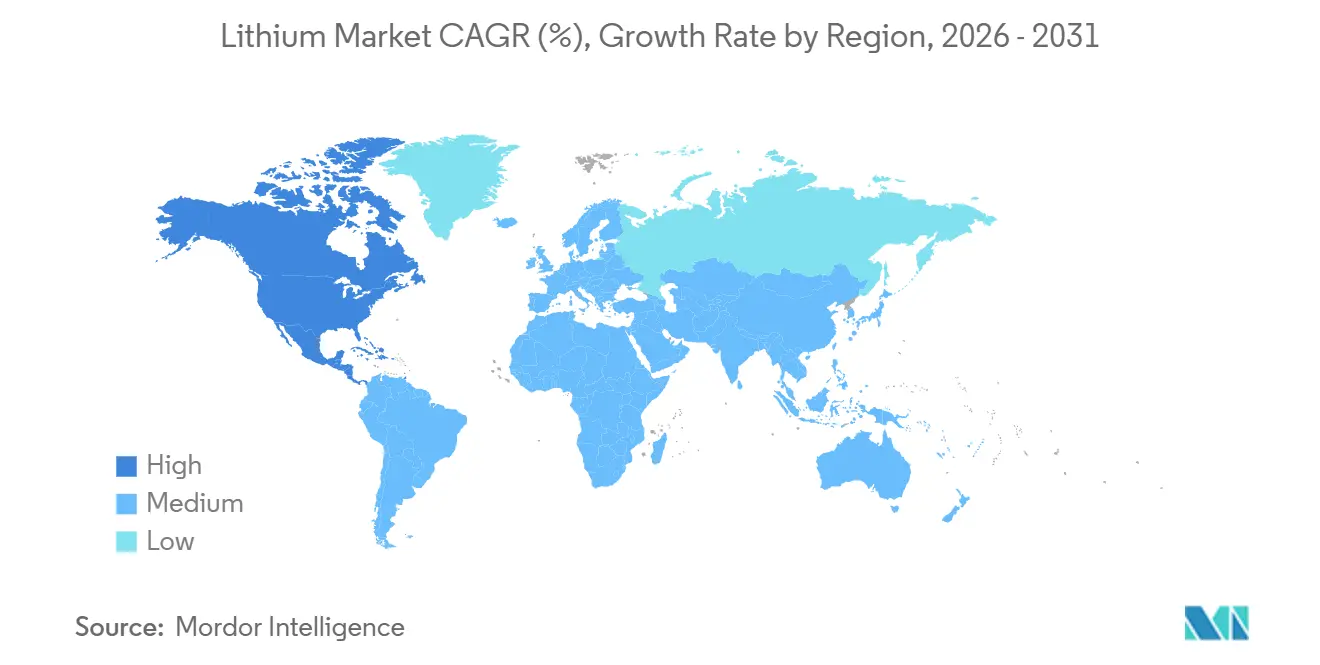
| Fastest Growing Market | North America |
| Largest Market | Asia-Pacific |
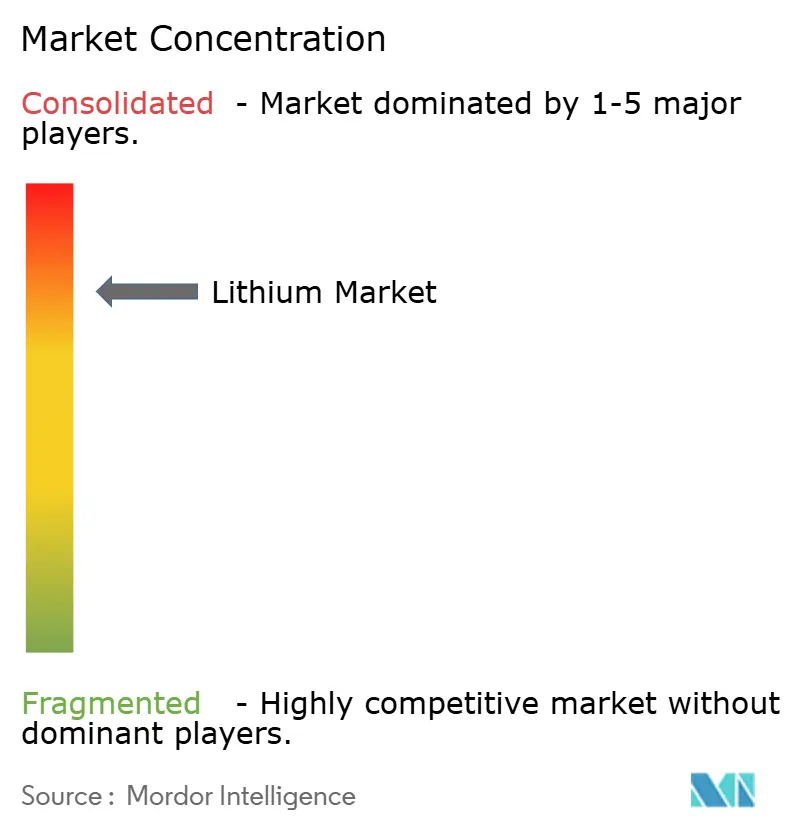
| Market Concentration | High |
Major Players *Disclaimer: Major Players sorted in no particular order Image © Mordor Intelligence. Reuse requires attribution under CC BY 4.0. | |
Lithium Market Analysis by Mordor Intelligence
The Lithium Market size is expected to increase from 1.54 Million LCE tons in 2025 to 1.84 Million LCE tons in 2026 and reach 4.43 Million LCE tons by 2031, growing at a CAGR of 19.24% over 2026-2031. Global demand is accelerating as electric-vehicle mandates become stricter, utility-scale storage transitions to four-hour configurations, and the first commercial direct-lithium-extraction units reduce project lead times. Battery-pack prices dropped below the significant USD 110 per kilowatt-hour mark in 2025, bridging the total-cost-of-ownership gap with internal-combustion vehicles. This led automakers to enter into multi-year off-take agreements to secure feedstock for the decade. Concurrently, tier-2 Chinese converters expanded refining capacity more rapidly than upstream supply, causing spot prices to fall below USD 10,000 per ton and forcing high-cost producers to suspend operations. The resulting tension between record consumption and periodic oversupply is altering contract structures, with Original Equipment Manufacturers (OEMs) demanding floor-price clauses while miners focus on vertical integration to maintain margins.
Key Report Takeaways
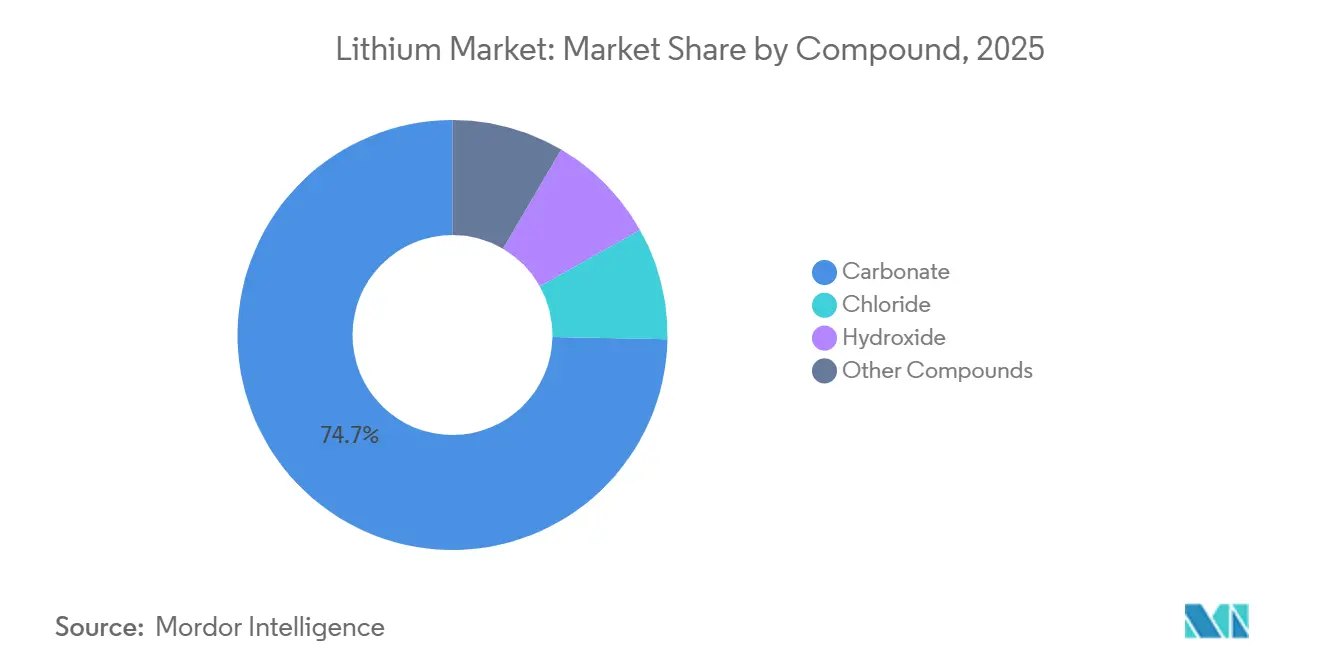
- By compound, carbonate led with 74.68% of the lithium market share in 2025, while hydroxide is projected to expand at a 23.07% CAGR through 2031.
- By application, the battery segment accounted for 79.59% of the lithium market share in 2025 and is expected to advance at a 21.19% CAGR through 2031.
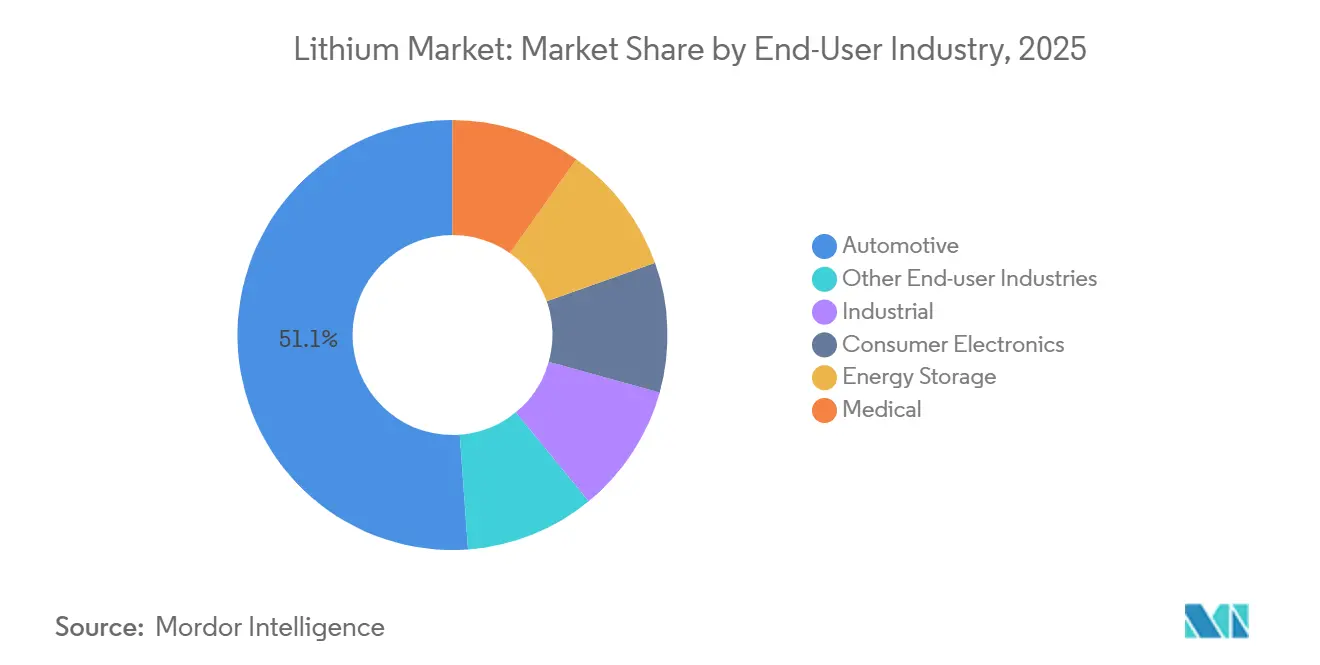
- By end-user industry, automotive held 51.14% of the lithium market share in 2025, and the segment is forecast to grow at a 21.73% CAGR through 2031.
- By geography, Asia-Pacific dominated with 65.36% of the lithium market share in 2025, while North America is forecast to grow at a 25.78% CAGR through 2031.
Note: Market size and forecast figures in this report are generated using Mordor Intelligence’s proprietary estimation framework, updated with the latest available data and insights as of 2026.
Global Lithium Market Trends and Insights
Drivers Impact Analysis*
| Driver | (~) % Impact on CAGR Forecast | Geographic Relevance | Impact Timeline |
|---|---|---|---|
| EV penetration targets and battery-cost parity | +6.8% | Global, with early acceleration in China, EU, and California | Medium term (2-4 years) |
| Grid-scale storage mandates (≥4 h) in the U.S., EU, and China | +4.2% | North America, EU, China coastal provinces | Medium term (2-4 years) |
| OEM-backed off-take agreements securing supply | +3.1% | Global, concentrated in North America and EU supply chains | Long term (≥4 years) |
| Direct-lithium-extraction (DLE) pilot breakthroughs | +2.9% | U.S. Imperial Valley, Argentina Salta, Chile Atacama | Long term (≥4 years) |
| Geothermal-brine co-production incentives (Imperial Valley, Salta) | +1.8% | U.S. Imperial Valley, Argentina Salta and Catamarca | Long term (≥4 years) |
| Source: Mordor Intelligence | |||


EV Penetration Targets and Battery-Cost Parity
An average lithium-iron-phosphate pack price of USD 108 per kilowatt-hour in 2025, down from USD 139 in 2023, tipping the total-cost-of-ownership in favor of battery-electric models for compact and midsize cars. China responded first, with passenger-EV sales surpassing 10 million units and reaching roughly 40% of new registrations in 2025. Europe tightened its fleet-average rule to 93.6 grams of CO₂ per kilometer in the same year, effectively requiring at least 20% zero-emission sales to avoid penalties. California’s Advanced Clean Cars II regulation requires 35% zero-emission sales by 2026, pulling forward automaker compliance investments. As each region synchronizes targets with cost declines, lithium market adoption is compressing into a steeper S-curve, and upstream suppliers are racing to keep pace.
Grid-scale storage mandates (≥4 h) in the U.S., EU, and China
The European Network of Transmission System Operators issued connection codes in late 2024 that compel renewable plants above 50 MW to pair with four-hour storage, doubling lithium market demand per gigawatt added. California shifted its Self-Generation Incentive Program budget entirely to long-duration storage in 2025, while Federal Energy Regulatory Commission (FERC) Order 841 opened all U.S. wholesale markets to batteries, enabling revenue stacking[1]FERC, “Order 841 Market Participation,” ferc.gov. China’s 14th Five-Year Plan targeted 30 GW of new storage by 2025, and provinces such as Guangdong now require 15% storage against new solar farms, adding 150,000 tons of lithium use in 2025. These mandates create lumpy procurement waves that concentrate orders ahead of interconnection deadlines, challenging miners with inherently slower build cycles.
OEM Off-Take Agreements that Secure Supply
General Motors invested USD 625 million in Lithium Americas’ Thacker Pass project in the lithium market for first-call rights on all Phase 1 output, effectively transforming the automaker into a partial miner. Volkswagen signed a binding supply with Patriot Battery Metals in Quebec, and Stellantis, LG Energy Solution, and Umicore each contracted with Vulcan Energy Resources for geothermal-brine hydroxide in Germany. Typical contracts include floor prices near USD 15,000 per ton of carbonate, insulating new mines from spot volatility and lowering their cost of debt by up to 300 basis points. This structure redistributes price risk and accelerates project timelines, fragmenting traditional producer dominance.
Commercial-Scale Direct-Lithium-Extraction Breakthroughs
ExxonMobil’s Imperial Valley pilot sustained 90% lithium recovery and plans 100,000 tons of annual carbonate by 2028. DuPont adapted FilmTec membranes to produce similar yields at Argentina’s Salar de Olaroz, even at modest brine concentrations. Metal-organic framework sorbents originating from Nanjing Tech University now achieve lithium selectivity ratios above 1,000:1, lowering reagent loss in high-salinity brines. By eliminating 18-month evaporation ponds, DLE aligns supply responsiveness with fast demand cycles. This unlocks geothermal waste streams that also provide renewable heat, improving project economics and enabling premium “green lithium” branding under the EU Battery Regulation.
Restraints Impact Analysis*
| Restraint | (~) % Impact on CAGR Forecast | Geographic Relevance | Impact Timeline |
|---|---|---|---|
| Short-cycle oversupply from Tier-2 Chinese converters | -2.4% | Global, with price transmission from China spot markets | Short term (≤2 years) |
| Interest-rate shocks delaying ESS procurement | -1.6% | North America and EU project finance markets | Short term (≤2 years) |
| Nascent sodium-ion battery commercialization | -0.9% | China A-segment vehicles, stationary storage in emerging markets | Medium term (2-4 years) |
| Source: Mordor Intelligence | |||
Short-Cycle Oversupply from Tier-2 Chinese Converters
Between 2023 and 2025, smaller refiners in Jiangxi and Sichuan added 400,000 tons of annual carbonate-equivalent capacity without securing feedstock, flooding the spot market and driving prices below USD 10,000 per ton by mid-2025. Provincial regulators shuttered 18 sub-scale plants for environmental breaches, yet inventories still exceeded 200,000 tons and kept prices depressed. CATL, despite vertical integration, halted construction of its Jianxiawo refinery as margins collapsed, illustrating the limits of scale when oversupply emerges. Major producers such as Albemarle idled 30% of Kemerton hydroxide output, but those measures only slowed the inventory drawdown rather than clearing the glut. The imbalance discourages new mine investment now, risking a deficit once mid-decade projects reach end-of-life.
Interest-Rate Shocks Delaying Energy-Storage Procurement
The United States maintained the federal-funds rate above 5% through mid-2024, raising the weighted-average cost of capital for storage projects by as much as 200 basis points. GridStor warned that delayed Treasury guidance on tax-credit transferability pushed several gigawatt-hours of systems out to 2026. Europe faced similar friction, with the European Central Bank’s deposit rate peaking at 4% and adding EUR 50 million to financing costs for a typical 500 MWh project[2]European Central Bank, “Monetary Policy Decisions,” ecb.europa.eu. Higher borrowing costs hit long-duration batteries hardest because they require four-hour configurations that multiply upfront lithium intensity. As equity partners wait for rate cuts and clarity on incentive stacking, procurement timelines slip, muting short-term demand growth.
*Our forecasts treat driver/restraint impacts as directional, not additive. The impact forecasts reflect baseline growth, mix effects, and variable interactions.
Segment Analysis
By Compound: Carbonate Anchors Volume While Hydroxide Accelerates
The carbonate held 74.68% of volume in 2025 due to its established role in lithium iron phosphate (LFP) cathodes in the lithium market. Hydroxide is projected to grow at a 23.07% CAGR through 2031, driven by the increasing adoption of nickel-rich cathodes for premium EVs and emerging aviation applications. Tesla’s 4680 high-nickel format began volume manufacturing in 2024 and is being widely licensed, further boosting hydroxide growth. Integrated refiners are accepting the USD 2,500 processing surcharge per ton as hydroxide commands a 25% price premium and ensures long-term contracts with reduced churn. China’s export controls on extraction technology, implemented in July 2025, are compelling foreign players to innovate alternative conversion methods, fueling patent activity that will sustain differentiation and margins.
Investors consider carbonate a stabilizing factor in the lithium market, supporting baseline demand for cost-sensitive storage and small passenger vehicles. Hydroxide, on the other hand, provides growth opportunities in energy-dense applications such as heavy trucks, vertical takeoff aircraft, and extended-range SUVs. Albemarle’s Kemerton facility is well-positioned for a price recovery, with its expansion to 100,000 tons per year mechanically complete. As the decade progresses, resource holders capable of switching between carbonate and hydroxide production are expected to leverage arbitrage opportunities as battery chemistries shift with metal prices and policy incentives.


By Application: Batteries Dominate, Ancillary Uses Provide Stable Niches
Batteries accounted for 79.59% of the lithium market share in 2025 and are projected to grow at a 21.19% CAGR through 2031, maintaining their central role in the global energy transition. Lubricants and grease experienced modest growth, replacing calcium soaps in high-temperature bearings, though their volumes remain significantly smaller than those of batteries. Glass, ceramics, and air-treatment applications continue to provide steady demand, helping to buffer miners during periods of reduced battery demand. Regulations emphasizing life-cycle carbon reporting are creating a premium segment for suppliers offering renewable power, low-water footprints, or geothermal co-production, informally referred to as “green lithium.”
Stationary storage is the fastest-growing segment within the battery category, driven by four-hour grid mandates that increase material intensity per installed megawatt. While interest rate risks may slow near-term installations, policy support under the Inflation Reduction Act mitigates some financing challenges. Consumer electronics are growing at low single-digit rates, reflecting a mature but stable market for fine-grade carbonate. This maturity helps establish price floors during fluctuations in EV demand. Overall, the application mix highlights the structural tightness of the lithium market, despite occasional supply surpluses.
By End-User Industry: Automotive Extends Its Lead
Automotive absorbed 51.14% of global lithium in 2025 and is projected to grow at a 21.73% CAGR through 2031, further tightening supply conditions in the lithium market. Consumer electronics will drift sideways as handset replacement cycles lengthen. Industrial vehicles, including forklifts and mining trucks, are switching from lead-acid to lithium-ion because reduced downtime offsets the higher upfront cost. The lithium industry is also finding niche growth in medical implants and portable oxygen concentrators, which require ultra-high-purity grades that command premium pricing.
Regulation is the primary catalyst. California targets 100% zero-emission new light-duty sales by 2035, and Europe’s tightening fleet rule all but mandates electrification of mainstream models. China’s dual-credit policy remains highly effective, driving battery-electric sales of more than 10 million units in 2025 in the lithium market. As automakers roll over model cycles, each redesign increases pack size to support longer range or faster charging, reinforcing demand growth on a per-vehicle basis even when unit sales level off.
Geography Analysis
Asia-Pacific consumed 65.36% of lithium in 2025, anchored by China’s global cell output and 98% of LFP cathode capacity. Australia remains the world’s largest miner, shipping 1.98 million tons of spodumene concentrate in the first half of 2025 and achieving a record 631,000 tons in March 2026 after cyclone disruptions cleared. Japan and South Korea form a distinct sub-cluster, focusing on high-nickel chemistries for export to North American and European automakers in the lithium market.
North America is the fastest-growing region, with a forecast CAGR of 25.78% through 2031, driven by the Inflation Reduction Act’s requirement for 50% critical-mineral sourcing from free-trade partners by 2027. Thacker Pass is expected to anchor domestic supply with 40,000 tons per year starting in 2027. In Canada, Quebec’s Patriot Battery Metals has secured Volkswagen and LG Energy Solution as off-takers and plans to begin concentrate production by 2026. Mexico’s Sonora brines are attracting Chinese investment, though political uncertainties may delay timelines in the lithium market.
Europe’s demand is increasing due to gigafactory developments in Sweden, Germany, and Hungary. The EU Battery Regulation is encouraging local sourcing, with geothermal-brine projects in the Upper Rhine Valley leading the way in carbon-neutral hydroxide production. South America is strengthening its supply position through Argentina’s Régimen de Incentivo para Grandes Inversiones (RIGI) investment regime, which provides tax certainty for projects exceeding USD 200 million. SQM and Codelco aim to expand their Nova Andino joint venture to 260,000 tons by 2026 in the lithium market. In Africa, Zimbabwe’s 2024 ban on raw ore exports removed 200,000 tons of spodumene from the global market, prompting Chinese refiners to diversify away from Australian feedstock.

Competitive Landscape
The market is highly concentrated, with the five largest firms including Albemarle Corporation, SQM, Tianqi Lithium Corporation, Ganfeng Lithium Group Co., Ltd, and Rio Tinto. The Albemarle and SQM operate full-stack models from brine or hard-rock to refined chemicals, bearing high capital needs but safeguarding margin across cycles. Australian miners Pilbara and Mineral Resources emphasize concentrate exports, trading upside on refining spreads for shorter payback. Chinese converters dominate mid-stream refining with 65% of global capacity, but oversupply from Tier-2 entrants exposed the vulnerability of merchant models during 2025’s price collapse.
Direct-lithium-extraction is the emerging wedge. ExxonMobil filed 15 patents between 2024 and 2025 covering ion-exchange media, signaling its intent to become a significant low-carbon supplier. Vulcan Energy Resources positions its geothermal-brine hydroxide as carbon neutral and has locked in Stellantis, LG Energy Solution, and Umicore as customers willing to pay a premium for compliance credits in Europe. Technology export controls that China imposed in July 2025 raise barriers for foreign refiners, accelerating proprietary process development and fragmenting the supply base. OEM equity stakes shift funding dynamics by lowering debt spreads, evidenced by General Motors’ placement at Thacker Pass, which financed Phase 1 at borrowing costs roughly 250 basis points below peers without captive offtake.
As the decade advances, competition will hinge less on scale and more on purity, carbon footprint, and contract flexibility. Producers that can certify renewable power, low water use, and low embedded carbon are already commanding a 5%-10% price premium from European battery makers sensitive to Scope 3 emissions reporting. Meanwhile, the lithium industry braces for sodium-ion encroachment at the low end of the battery spectrum, though energy-dense sectors are expected to stay firmly in the lithium market through 2031.
Lithium Industry Leaders
Albemarle Corporation
SQM
Tianqi Lithium Corporation
Rio Tinto
Ganfeng Lithium Group Co., Ltd
- *Disclaimer: Major Players sorted in no particular order

Recent Industry Developments
- April 2026: NavPrakriti announced plans to invest over INR 1 billion (approximately USD 12 million) to establish a critical minerals refining facility in Odisha. The proposed greenfield plant, which aims to enhance domestic recovery of lithium, cobalt, and nickel while reducing reliance on imports, is scheduled to become operational by the fiscal year 2028–29 with a capacity to process up to 5,000 metric tons per annum of end-of-life lithium-ion batteries.
- March 2025: Rio Tinto completed its acquisition of Arcadium Lithium plc (Arcadium Lithium) for USD 6.7 Billion. The acquisition established Rio Tinto as a major player in the supply of energy transition materials and as a major lithium producer, with one of the world’s largest lithium resource bases.


Global Lithium Market Report Scope
Lithium (Li) is a soft, silvery-white alkali metal with an atomic number of 3, recognized as the lightest solid element. It is essential for high-energy-density rechargeable batteries used in electronics and electric vehicles, and is also a key medication for treating bipolar disorder.
The Lithium Market is segmented into compound, application, end-user industry, and geography. By compound, the market is segmented into carbonate, chloride, hydroxide, and other compounds. By application, the market is segmented into battery, lubricants and grease, air treatment, pharmaceuticals, glass and ceramics (including frits), polymer, and other applications. By end-user industry, the market is segmented into automotive, industrial, consumer electronics, energy storage, medical, and other end-user industries. The report also covers the market size and forecasts for lithium in 16 countries across major regions. For each segment, the market sizing and forecasts have been done on the basis of volume (LCE Tons).
By Compound
| Carbonate |
| Chloride |
| Hydroxide |
| Other Compounds |
By Application
| Battery |
| Lubricants and Grease |
| Air Treatment |
| Pharmaceuticals |
| Glass and Ceramics (Including Frits) |
| Polymer |
| Other Applications |
By End-User Industry
| Automotive |
| Industrial |
| Consumer Electronics |
| Energy Storage |
| Medical |
| Other End-user Industries |
By Geography
| Production and Reserve Analysis | Australia | |
| Chile | ||
| China | ||
| Argentina | ||
| Zimbabwe | ||
| United States | ||
| Other Regions | ||
| Consumption Analysis | Asia-Pacific | China |
| Japan | ||
| India | ||
| South Korea | ||
| Australia and New Zealand | ||
| Rest of Asia-Pacific | ||
| North America | United States | |
| Canada | ||
| Mexico | ||
| Europe | Germany | |
| United Kingdom | ||
| France | ||
| Italy | ||
| NORDIC Countries | ||
| Rest of Europe | ||
| South America | Brazil | |
| Argentina | ||
| Rest of South America | ||
| Middle-East and Africa | Saudi Arabia | |
| South Africa | ||
| Rest of Middle-East and Africa | ||
| By Compound | Carbonate | ||
| Chloride | |||
| Hydroxide | |||
| Other Compounds | |||
| By Application | Battery | ||
| Lubricants and Grease | |||
| Air Treatment | |||
| Pharmaceuticals | |||
| Glass and Ceramics (Including Frits) | |||
| Polymer | |||
| Other Applications | |||
| By End-User Industry | Automotive | ||
| Industrial | |||
| Consumer Electronics | |||
| Energy Storage | |||
| Medical | |||
| Other End-user Industries | |||
| By Geography | Production and Reserve Analysis | Australia | |
| Chile | |||
| China | |||
| Argentina | |||
| Zimbabwe | |||
| United States | |||
| Other Regions | |||
| Consumption Analysis | Asia-Pacific | China | |
| Japan | |||
| India | |||
| South Korea | |||
| Australia and New Zealand | |||
| Rest of Asia-Pacific | |||
| North America | United States | ||
| Canada | |||
| Mexico | |||
| Europe | Germany | ||
| United Kingdom | |||
| France | |||
| Italy | |||
| NORDIC Countries | |||
| Rest of Europe | |||
| South America | Brazil | ||
| Argentina | |||
| Rest of South America | |||
| Middle-East and Africa | Saudi Arabia | ||
| South Africa | |||
| Rest of Middle-East and Africa | |||


Key Questions Answered in the Report
What is the size of the lithium market?
The lithium market size stands at 1.84 million LCE tons in 2026 and is projected to expand to 4.43 million LCE tons by 2031.
Which compound held the largest share in 2025?
The carbonate commanded 74.68% of total volume in 2025 because of its central role in lithium-iron-phosphate cathodes used in mainstream electric vehicles, based on Mordor Intelligence data.
What end-user industry dominated lithium market in 2025?
Automotive accounted for 51.14% of 2025 demand, driven by EV adoption mandates reported by Mordor Intelligence.
Which region is growing fastest through 2031?
North America shows the fastest regional CAGR of 25.78% through 2031, propelled by the Inflation Reduction Act sourcing rules that boost in the lithium market, domestic projects, according to Mordor Intelligence.
Page last updated on:


