Market Overview
| Study Period | 2020 - 2031 |
|---|---|
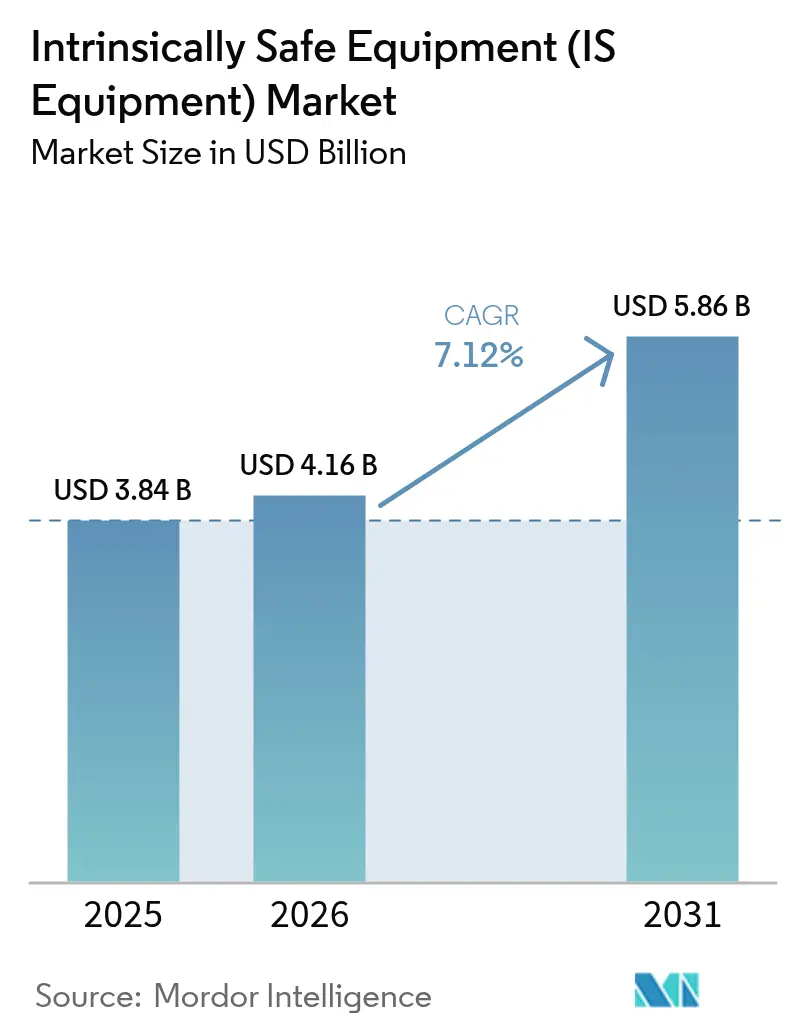
| Market Size (2026) | USD 4.16 Billion |
| Market Size (2031) | USD 5.86 Billion |
| Growth Rate (2026 - 2031) | 7.12% CAGR |
| Fastest Growing Market | Asia Pacific |
| Largest Market | North America |
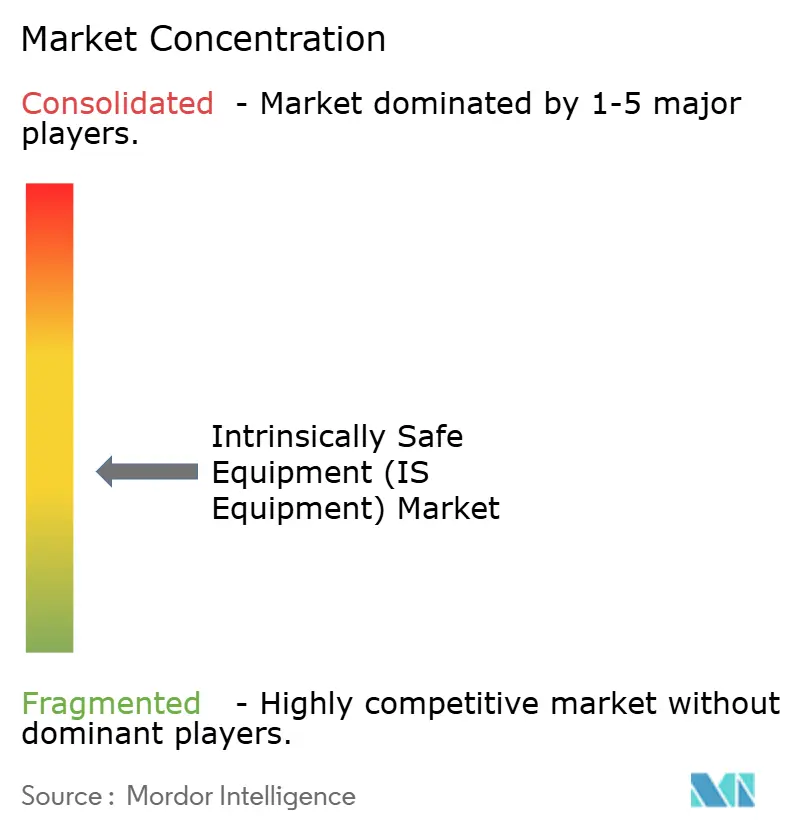
| Market Concentration | Medium |
Major Players *Disclaimer: Major Players sorted in no particular order Image © Mordor Intelligence. Reuse requires attribution under CC BY 4.0. | |
Intrinsically Safe Equipment (IS Equipment) Market Analysis by Mordor Intelligence
The intrinsically safe equipment market size is projected to be USD 3.84 billion in 2025, USD 4.16 billion in 2026, and reach USD 5.86 billion by 2031, growing at a CAGR of 7.12% from 2026 to 2031. End users are moving from flameproof enclosures toward low-energy circuits, lowering installation cost and fueling demand for certified wireless field devices. A rolling update of the IEC 60079 standards is forcing recertification, which entrenches incumbents that operate in-house conformity labs. Component shortages that began in 2024 continue to extend lead times, prompting large vendors to tighten supplier integration. Growth is further supported by upstream oil and gas investment rebounds, plus emerging retrofit work in grain handling and textile mills where operators now favor intrinsically safe sensor networks.
Key Report Takeaways
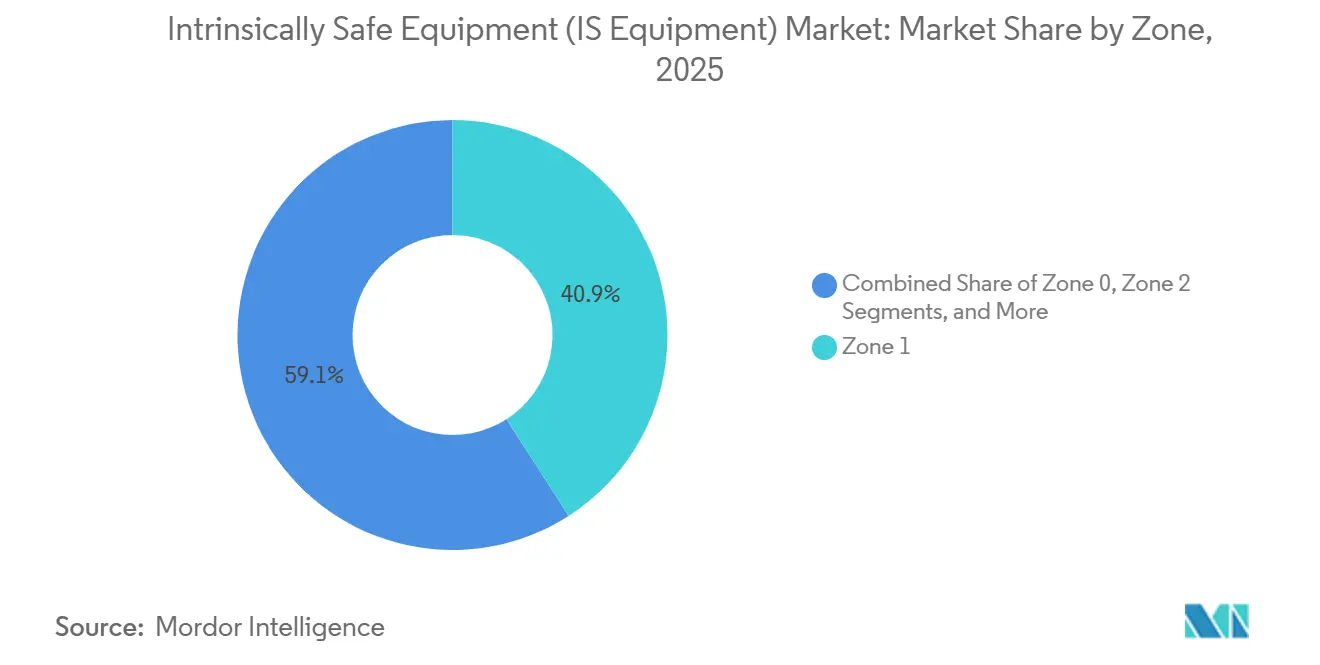
- By zone, Zone 1 installations led with 40.91% revenue share in 2025. Zone 0 is forecast to expand at an 8.27% CAGR through 2031.
- By class, Class 1 commanded 74.87% of the intrinsically safe equipment market share in 2025. Class 3 is the fastest-growing class, advancing at a 7.69% CAGR to 2031.
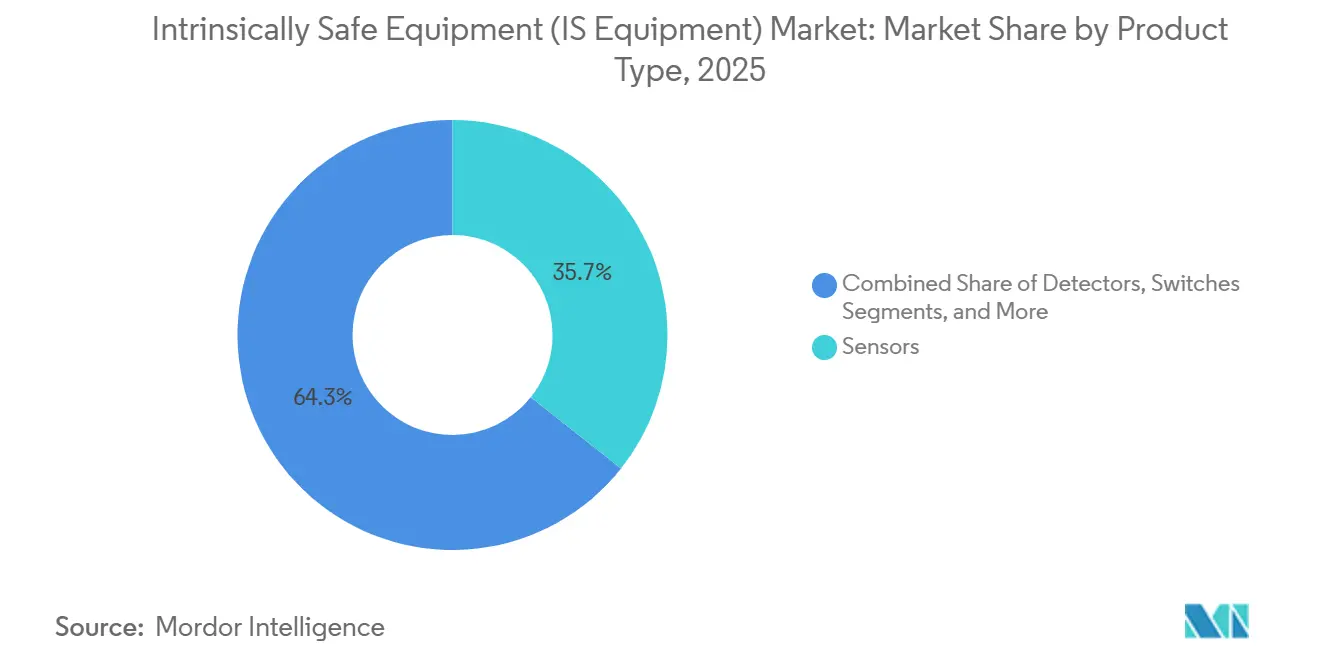
- By product type, sensors accounted for 35.67% of the intrinsically safe equipment market in 2025. Detectors are set to grow the quickest, rising at a 7.49% CAGR over 2026-2031.
- By end user, oil and gas accounted for 57.12% of revenue in 2025. Chemical and petrochemical end users are forecast to post an 8.29% CAGR during 2026-2031.
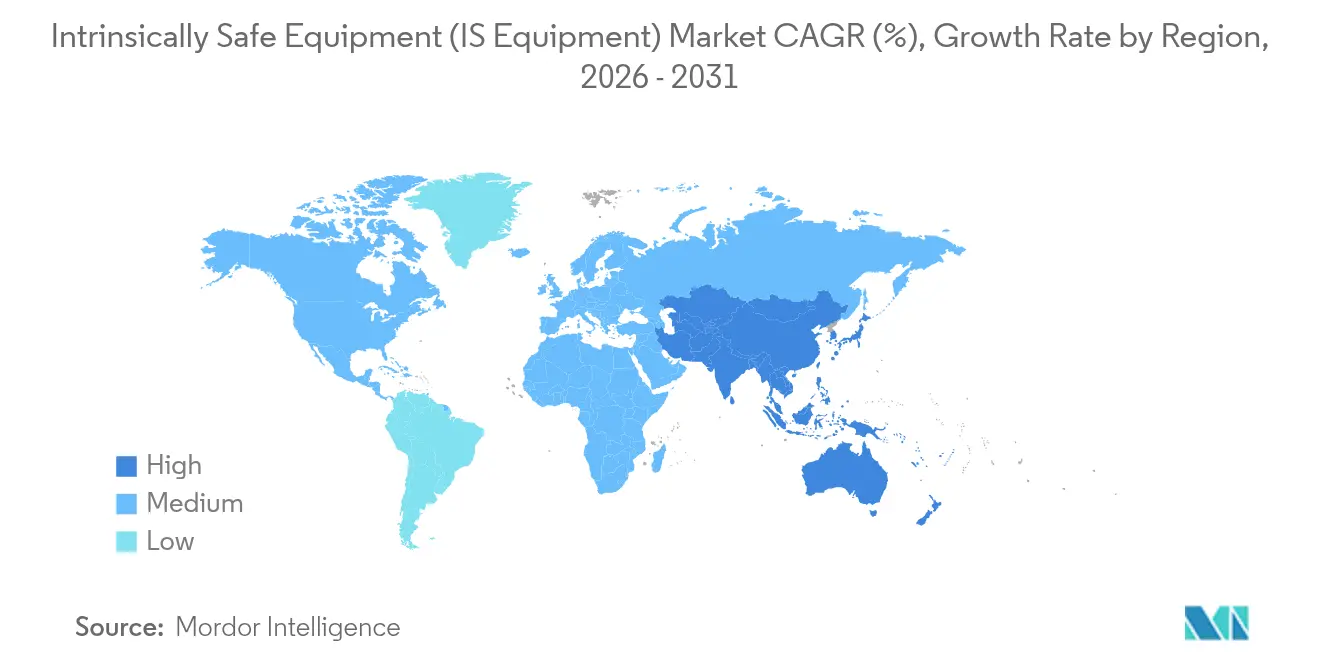
- By geography, North America accounted for 38.18% of 2025 demand. Asia-Pacific will be the fastest-expanding region at an 8.12% CAGR to 2031.
Note: Market size and forecast figures in this report are generated using Mordor Intelligence’s proprietary estimation framework, updated with the latest available data and insights as of 2026.
Global Intrinsically Safe Equipment (IS Equipment) Market Trends and Insights
Drivers Impact Analysis*
| Driver | (~) % Impact on CAGR Forecast | Geographic Relevance | Impact Timeline |
|---|---|---|---|
| Stringent Global Explosion-Safety Regulations | +1.8% | Global, tighter rules in Europe, Asia-Pacific, North America | Medium Term (2–4 Years) |
| Industry 4.0-Driven Demand for IS Sensors and Instrumentation | +1.5% | North America, Europe, Advanced Asia-Pacific Hubs | Medium Term (2–4 Years) |
| Expansion of Oil and Gas and Mining Activities | +1.3% | Middle East, North America Shale, Asia-Pacific Coal, Africa Minerals | Long Term (≥4 Years) |
| Cost-Saving Shift from Ex d to Ex i Architectures | +1.0% | Global, Early Adoption in Europe and North America | Short Term (≤2 Years) |
| Growth of Wireless IS Modules for Remote, Predictive Maintenance | +0.9% | Offshore North America and Europe, Remote Asia-Pacific Wellheads | Medium Term (2–4 Years) |
| Printed, Ultra-Low-Power Sensor Arrays Unlocking Retrofit Markets | +0.6% | Aging North American and European Sites | Long Term (≥4 Years) |
| Source: Mordor Intelligence | |||


Stringent Global Explosion-Safety Regulations
Recent updates to IEC 60079-11, IEC 60079-14, and IEC 60079-18 have reduced the allowable energy budgets for field devices, prompting manufacturers to redesign transmitters with lower capacitance and integrated fault detection.[1]International Electrotechnical Commission, “IEC 60079 Series Standards,” IEC.ch Europe enforces the ATEX Directive 2014/34/EU, while 38 countries now accept IECEx, creating dual-badge requirements that increase compliance costs while standardizing product platforms. The 2023 edition of NFPA 70 revised Article 500, prompting U.S. operators to replace legacy Division-rated gear with zone-certified intrinsically safe barriers. Middle Eastern buyers increasingly demand both ATEX and IECEx marks to simplify multi-partner projects, a trend that favors large vendors with accredited labs able to issue both certificates under one roof.
Industry 4.0-Driven Demand for IS Sensors and Instrumentation
A 2024 Rockwell Automation survey found that 68% of process plants plan to roll out IIoT in hazardous zones by 2027. ADNOC deployed 5G private networks at Ruwais in 2024, enabling real-time video analytics from Zone 1 inspection robots that rely on intrinsically safe edge gateways. Emerson’s DeltaV now natively accepts WirelessHART field devices, letting refiners add measurement points without hot-work permits and cutting commissioning time by up to 60%. Cybersecurity is now part of safety audits, as IEC 62443 insists on encrypted firmware and signed updates, adding new cost layers but unlocking remote diagnostics revenue streams for vendors.
Expansion of Oil and Gas and Mining Activities
Global upstream capital outlays rebounded to USD 603 billion in 2024 and are projected to hit USD 738 billion by 2030. Saudi Aramco’s Jafurah program alone specifies thousands of intrinsically safe transmitters for Zone 1 compressors. Coal India Limited tendered 85,000 wireless gas monitors in 2025 to meet methane-detection mandates in underground faces. Copper mines in Chile and Peru are adding intrinsically safe dust sensors to concentrators to comply with stricter particulate limits, broadening demand beyond traditional petrochemical hubs.
Cost-Saving Shift from Ex d to Ex i Architectures
Pepperl and Fuchs recorded a 28% reduction in installed costs when customers swapped Ex d junction boxes for IS fieldbus segments on a 500-point refinery job.[2] Pepperl and Fuchs, “Ex d versus Ex i Cost Analysis White Paper 2024,” pepperl-fuchs.com Ex i circuits eliminate the need for explosion-proof cable glands and allow technicians to service live loops without gas-free certificates, reducing turnaround downtime. Siemens reported that intrinsically safe variants of its SITRANS P transmitter outsold Ex d models 60-40 in 2025, reversing the 2020 split. Brownfield retrofits drive the fastest adoption because wiring paths already exist, whereas Ex d upgrades force conduit upgrades that inflate project budgets.
Restraints Impact Analysis*
| Restraint | (~) % Impact on CAGR Forecast | Geographic Relevance | Impact Timeline |
|---|---|---|---|
| High Certification Cost and Design Complexity | -1.2% | Global, Heavier on Small and Mid-Size Manufacturers | Short Term (≤2 Years) |
| Fragmented Approval Timelines Across Regions | -0.9% | Cross-Border Projects in Europe, Middle East, Asia-Pacific | Medium Term (2–4 Years) |
| Shortage of Certified IS-Grade Electronic Components | -0.7% | Global, Barriers and Transmitters Most Exposed | Short Term (≤2 Years) |
| Rising Cybersecurity-Compliance Cost for IS Wireless Devices | -0.5% | North America, Europe, Advanced Asia-Pacific Markets | Medium Term (2–4 Years) |
| Source: Mordor Intelligence | |||
High Certification Cost and Design Complexity
Securing ATEX, IECEx, and NEC approvals costs USD 50,000-150,000 per product family, a burden that delays break-even for new entrants.[3] IECEx Secretariat, “Certification Scheme Fees and Timelines,” iecex.com Entity parameter-matching requirements force companies to produce exhaustive documentation, and the addition of IEC 62443 cybersecurity testing has further complicated the process by extending laboratory schedules by 3–4 months. These delays not only slow product launches but also increase working capital requirements, as firms must bear the financial burden of prolonged compliance cycles. Smaller vendors, who often lack the resources to absorb these costs independently, frequently turn to distributor partnerships where the distributor finances certification in exchange for exclusivity.
Fragmented Approval Timelines Across Regions
ATEX certification reviews typically take 12–18 months; IECEx approvals can take up to 24 months for novel designs; and North American Division‑1 testing typically takes 6–9 months. These lengthy, regionally varied timelines often force companies with global ambitions to stagger product launches, inadvertently giving local competitors an early advantage in their respective markets. Honeywell cited an 11-month delay between its IECEx certificate and Canadian CSA mark for a wireless detector, during which two competitors filled distributor shelves.[4]Honeywell International, “Investor Presentation Q4 2024,” honeywell.com Lack of mutual recognition keeps inventory buffers high and slows cash conversion.
*Our updated forecasts treat driver/restraint impacts as directional, not additive. The revised impact forecasts reflect baseline growth, mix effects, and variable interactions.
Segment Analysis
By Zone: Continuous-Hazard Areas Catalyze Zone 0 Upswing
Zone 1 applications accounted for 40.91% revenue in 2025, anchored by pump seals and loading racks in refineries. The intrinsically safe equipment market size for Zone 0 deployments is projected to grow fastest at an 8.27% CAGR, as operators install low-power transmitters directly within vapor spaces to reduce leak paths. Wireless IS gateways are gaining share in Zone 2 retrofits, where their ability to avoid cable tray modifications shortens shutdown windows. Dust zones, especially Zone 20 inside spray dryers, are benefiting from the stricter EN 60079-31 testing protocol, which pushed many food and pharma plants to replace legacy indicators with IS LED models.
Continued adoption of printed, ultra-low-power arrays in Zone 2 pipe racks enables corrosion monitoring without energizing live circuits. LNG terminals are a high-value niche because every train includes thousands of Zone 0 temperature points, and owners prefer intrinsic safety to avoid heavy Ex d housings that complicate skid layouts. Vendors that bundle WirelessHART or ISA100.11a stacks into Zone 0 sensors differentiate on commissioning speed and analytics readiness.


By Class: Class 1 Holds Lion’s Share, Fiber Sites Drive Class 3 Lift
Class 1 hazardous areas captured 74.87 of % intrinsically safe equipment market share in 2025 due to the dominance of flammable gas processes. Class 3, covering fiber and flying hazards in textile and woodworking plants, is on a 7.69% CAGR trajectory as Asian mills retrofit line-side lighting with IS certified LED strips. NEC 2023 clarified Division definitions, triggering resurveys that uncovered undocumented Class 1, Division 1 pockets, sparking new barrier orders.
Class 2 grain facilities are modernizing as insurers tie premium discounts to continuous dust monitoring, creating pull for sub-milliwatt particle detectors that meet intrinsic safety energy limits. Class 3 growth is strongest in Vietnam and Bangladesh, where export customers insist on ATEX certificates before awarding apparel contracts. Vendors offering bilingual documentation and rapid on-site testing secure early wins in these first-time buyer segments.
By Product Type: Detector Momentum Outpaces Sensor Base
Sensors held 35.67% revenue in 2025, formed by pressure, level, and flow instruments. Detectors now show the steepest climb at 7.49% CAGR, reflecting plants’ shift toward always-on multi-gas arrays linked to cloud analytics. The intrinsically safe equipment market size for detectors will benefit as MSA folds Bacharach assets into a unified platform that flags calibration drift before alarms fail.
Transmitters remain a workhorse but face protocol churn as Ethernet-APL reaches Zone 1 cabinets. Barriers and isolators encounter margin compression, yet those with built-in diagnostics retain pricing power. LED indicators enjoy steady replacement demand because solid-state designs last 100,000 hours and consume under 100 milliwatts. Printed strain and corrosion sensors, still classified under “other,” hold promise for brownfield pipework once certification test suites mature.
By End User: Petrochemical Buildout Surges Ahead of Oil and Gas Core
Oil and gas users contributed 57.12% of 2025 turnover, spanning upstream gathering, midstream pipelines, and downstream refining. Chemical and petrochemical operators are set to beat sector growth with an 8.29% CAGR as megaprojects in India and the Middle East demand Zone 1 analyzers from day one. Mining companies invest when rules require real-time methane data, opening the door for intrinsically safe mesh radios that withstand coal dust abrasion.
Power utilities fit IS gear on hydrogen storage skids and battery farms where off-gassing poses ignition risk. Food, pharma, and pulp mills install IS sensors in solvent recovery loops to avoid hot-work permits during sanitation cycles. Retrofit spending outpaces greenfield in mature regions, while greenfield mega-complexes lift Asia-Pacific volumes.
Geography Analysis
North America led with 38.18% revenue in 2025. U.S. shale fields specify intrinsically safe flow meters on wellheads to comply with updated pipeline safety codes, while Canadian oil sands deploy wireless IS nodes across remote tank farms to avoid fiber trenching. Mexico modernizes refineries, and Pemex now writes IECEx into every control-system tender, further enlarging the regional installed base.
Asia-Pacific is forecast to grow fastest at an 8.12% CAGR. China approved coal-to-chemicals complexes valued at over USD 20 billion in 2025, each requiring thousands of Zone 1 transmitters. India’s PESO made IECEx compulsory for new hazardous-area gear from January 2024, unleashing a wave of replacement at legacy plants. Japan and South Korea embed IS wireless sensors into 5G maintenance platforms at refineries and shipyards, highlighting a pivot from purely compliance to operational excellence.
Europe remains sizable but mature. German chemical majors retrofit for Industry 4.0 analytics using IS field devices to avoid rewiring, and the U.K. extends North Sea platform life with barrier upgrades after Health and Safety Executive audits. The Middle East accelerates dual-certified orders as Saudi Aramco and ADNOC execute multi-billion-dollar expansions. Africa and South America are nascent yet strategic, with Nigeria’s refinery start-ups and Brazil’s pre-salt offshore buildout needing Zone 0 subsea sensors. Currency volatility and local content rules shape vendor entry strategies in these emerging plays.

Competitive Landscape
The intrinsically safe equipment market is moderately fragmented. Honeywell, ABB, Siemens, Schneider Electric, Emerson, Eaton, Pepperl and Fuchs, R. Stahl, and BARTEC anchor the top tier through broad catalogs and accredited test labs. Their vertical integration speeds recertification whenever IEC 60079 updates drop, which locks-in multi-year service revenue.
Asian challengers, notably Kyland Technology and PATLITE, undercut pricing by up to 40% on IECEx-compliant wireless modules, but lingering doubts about lifecycle support limit penetration in tier-one LNG and offshore projects. Leaders, therefore, add cloud analytics and cybersecurity features to justify premiums. Rockwell Automation’s FactoryTalk platform now ingests IS sensor data for predictive pumping algorithms, shifting the battleground from hardware cost to outcome delivery.
Mergers continue, as shown by MSA’s USD 550 million Bacharach deal, which stitched portable and fixed detection into a single stack. Smaller specialists, Extronics for real-time locating, CorDEX for handheld thermal cameras, Bayco for portable lighting, claim niches where ruggedization exceeds mass-market needs. Vendors that can quickly certify wireless IS devices while embedding IEC 62443 safeguards gain mindshare as plants digitize.
Intrinsically Safe Equipment (IS Equipment) Industry Leaders
Honeywell International Inc.
Pepperl + Fuchs SE
ABB Ltd.
Siemens AG
Eaton Corporation plc
- *Disclaimer: Major Players sorted in no particular order

Recent Industry Developments
- June 2025: SGS issued guidance on IEC 60079-11 Edition 7 transitions, detailing 173 technical changes and urging manufacturers to conduct gap analyses.
- March 2025: IEC TC 31 began work on IEC 60079-101 to harmonize core principles across all protective methods, with task groups for AI, robotics, and hydrogen applications.
- January 2025: IEC released the IEC 60079:2025 SER package consolidating explosion-protection standards, including wireless and cybersecurity provisions.
- October 2024: Honeywell restructured into an Industrial Automation segment to integrate sensing, gas detection, and control solutions for hazardous industries.


Global Intrinsically Safe Equipment (IS Equipment) Market Report Scope
The Intrinsically Safe Equipment Market Report is Segmented by Zone (Zone 0, Zone 20, Zone 1, Zone 21, Zone 2, Zone 22), Class (Class 1, Class 2, Class 3), Product Type (Sensors, Detectors, Switches, Transmitters, Isolators and Barriers, LED Indicators, Other Product Types), End User (Oil and Gas, Mining, Power and Utilities, Chemical and Petrochemical, Processing and Manufacturing, Other End Users), and Geography (North America, South America, Europe, Asia-Pacific, Middle East, Africa). The Market Forecasts are Provided in Terms of Value (USD).
By Zone
| Zone 0 |
| Zone 20 |
| Zone 1 |
| Zone 21 |
| Zone 2 |
| Zone 22 |
By Class
| Class 1 |
| Class 2 |
| Class 3 |
By Product Type
| Sensors |
| Detectors |
| Switches |
| Transmitters |
| Isolators and Barriers |
| LED Indicators |
| Other Types |
By End User
| Oil and Gas |
| Mining |
| Power and Utilities |
| Chemical and Petrochemical |
| Processing and Manufacturing |
| Other End Users |
By Geography
| North America | United States | |
| Canada | ||
| Mexico | ||
| South America | Brazil | |
| Argentina | ||
| Rest of South America | ||
| Europe | Germany | |
| United Kingdom | ||
| France | ||
| Spain | ||
| Italy | ||
| Rest of Europe | ||
| Asia-Pacific | China | |
| India | ||
| Japan | ||
| South Korea | ||
| Rest of Asia-Pacific | ||
| Middle East and Africa | Middle East | Saudi Arabia |
| United Arab Emirates | ||
| Turkey | ||
| Rest of Middle East | ||
| Africa | South Africa | |
| Nigeria | ||
| Rest of Africa | ||
| By Zone | Zone 0 | ||
| Zone 20 | |||
| Zone 1 | |||
| Zone 21 | |||
| Zone 2 | |||
| Zone 22 | |||
| By Class | Class 1 | ||
| Class 2 | |||
| Class 3 | |||
| By Product Type | Sensors | ||
| Detectors | |||
| Switches | |||
| Transmitters | |||
| Isolators and Barriers | |||
| LED Indicators | |||
| Other Types | |||
| By End User | Oil and Gas | ||
| Mining | |||
| Power and Utilities | |||
| Chemical and Petrochemical | |||
| Processing and Manufacturing | |||
| Other End Users | |||
| By Geography | North America | United States | |
| Canada | |||
| Mexico | |||
| South America | Brazil | ||
| Argentina | |||
| Rest of South America | |||
| Europe | Germany | ||
| United Kingdom | |||
| France | |||
| Spain | |||
| Italy | |||
| Rest of Europe | |||
| Asia-Pacific | China | ||
| India | |||
| Japan | |||
| South Korea | |||
| Rest of Asia-Pacific | |||
| Middle East and Africa | Middle East | Saudi Arabia | |
| United Arab Emirates | |||
| Turkey | |||
| Rest of Middle East | |||
| Africa | South Africa | ||
| Nigeria | |||
| Rest of Africa | |||


Key Questions Answered in the Report
What is the forecast CAGR for intrinsically safe equipment through 2031?
The market is expected to grow at 7.12% over 2026-2031.
Which zone classification is expanding fastest?
Zone 0, covering continuous hazardous atmospheres, is projected to grow at 8.27% CAGR.
Who are the leading companies supplying certified wireless IS sensors?
Honeywell, ABB, Siemens, Emerson, and Pepperl and Fuchs all market IECEx-approved wireless devices.
Why are petrochemical projects driving demand in Asia-Pacific?
New cracker and polymer complexes in India, China, and the Middle East mandate intrinsic safety from startup, lifting regional orders.
How do updated IEC 60079 standards affect equipment vendors?
Every revision triggers recertification, so firms with in-house labs gain speed and lock in service contracts.
What factor most limits new entrants?
High multi-region certification costs, often totaling USD 50,000-150,000 per product line, lengthen payback periods.
Page last updated on:


