Enterprise AI Market Size and Share
Market Overview
| Study Period | 2020 - 2031 |
|---|---|
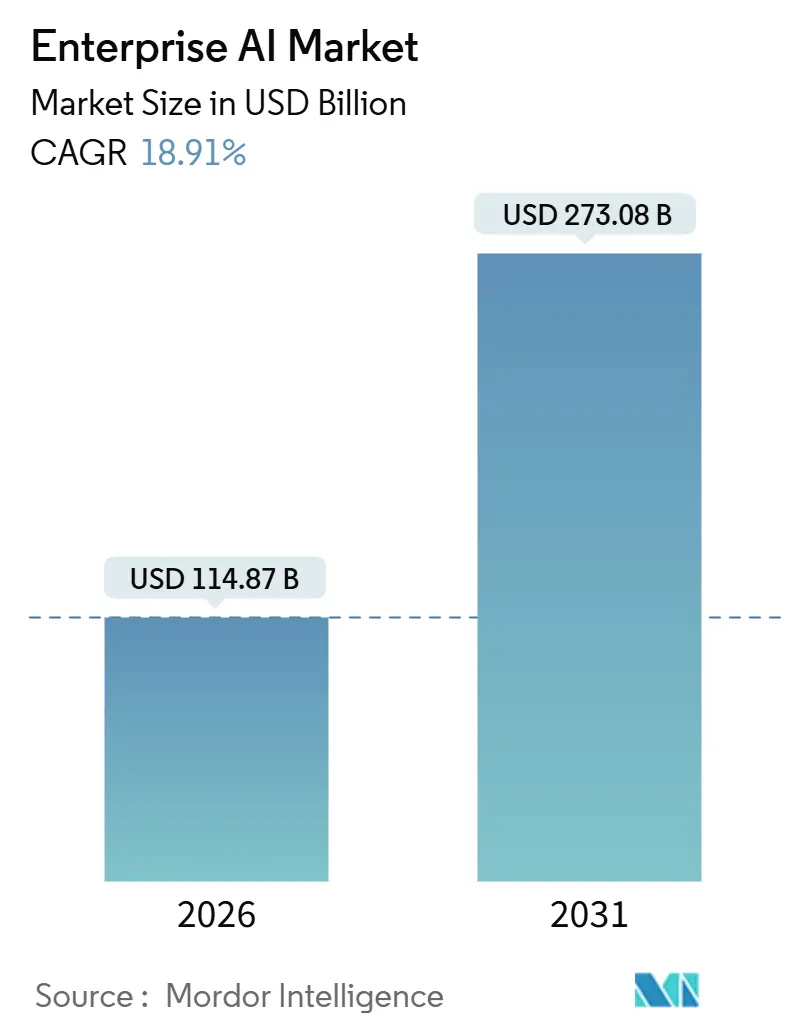
| Market Size (2026) | USD 114.87 Billion |
| Market Size (2031) | USD 273.08 Billion |
| Growth Rate (2026 - 2031) | 18.91% CAGR |
| Fastest Growing Market | Asia Pacific |
| Largest Market | North America |
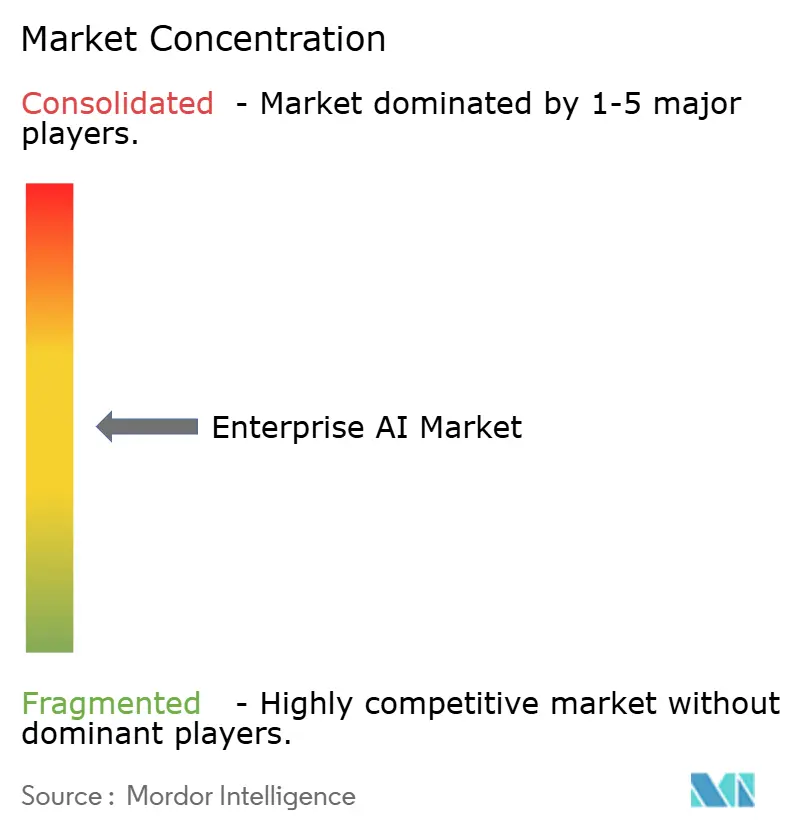
| Market Concentration | Medium |
Major Players *Disclaimer: Major Players sorted in no particular order Image © Mordor Intelligence. Reuse requires attribution under CC BY 4.0. | |
Enterprise AI Market Analysis by Mordor Intelligence
The Enterprise AI market size stood at USD 114.87 billion in 2026 and is projected to reach USD 273.08 billion by 2031, registering an 18.91% CAGR over 2026-2031. Enterprises are moving past pilots into production deployments, encouraged by specialized computing hardware, cloud-native AI-as-a-Service platforms, and vertical foundation models that lower entry barriers for mid-market firms. Hardware accelerators are expanding faster than the overall Enterprise AI market as organizations provision GPU and TPU clusters to serve large language models at scale. Small and medium enterprises are adopting foundation models via low-code platforms, while demand for AI-driven automation in customer service, software development, and supply chain optimization is accelerating. Compliance-ready vendors are gaining an advantage in the European Union following the provisional application of the AI Act.
Key Report Takeaways
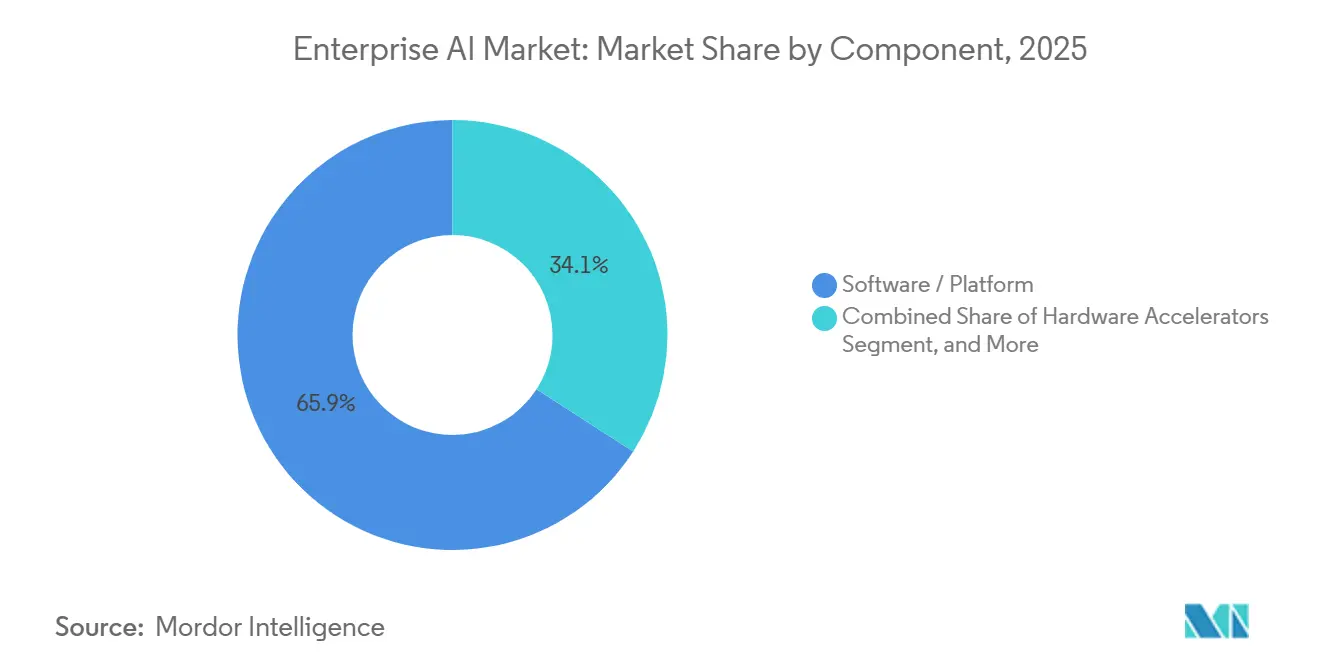
- By component, software and platforms led the Enterprise AI market with 65.89% of revenue in 2025, while hardware accelerators are projected to expand at a 19.39% CAGR through 2031.
- By organization size, large enterprises accounted for 71.43% of the Enterprise AI market share in 2025, while small and medium enterprises are expected to advance at a 19.34% CAGR during 2026-2031.
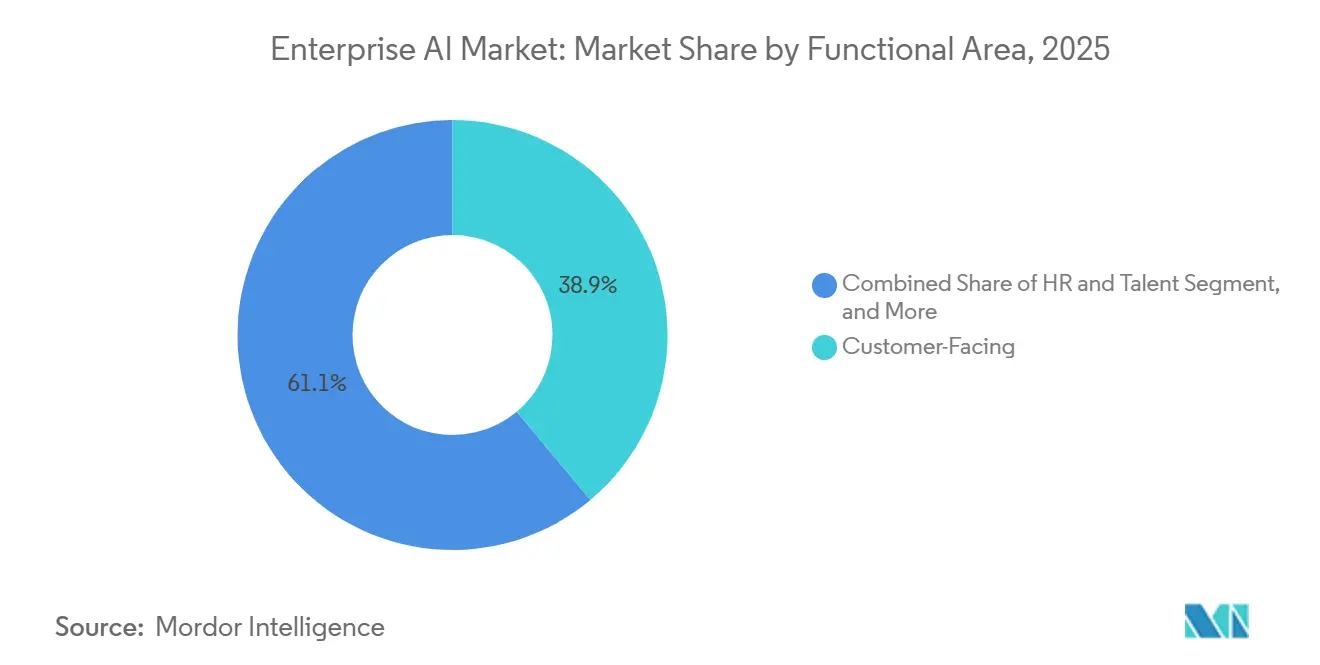
- By functional area, customer-facing applications accounted for 38.91% of 2025 spending, whereas human resources and talent workflows are forecast to grow at a 19.76% CAGR through 2031.
- By technology, machine learning and foundation models captured 49.77% adoption in 2025, while decision intelligence and optimization tools are anticipated to rise at a 19.71% CAGR over the forecast period.
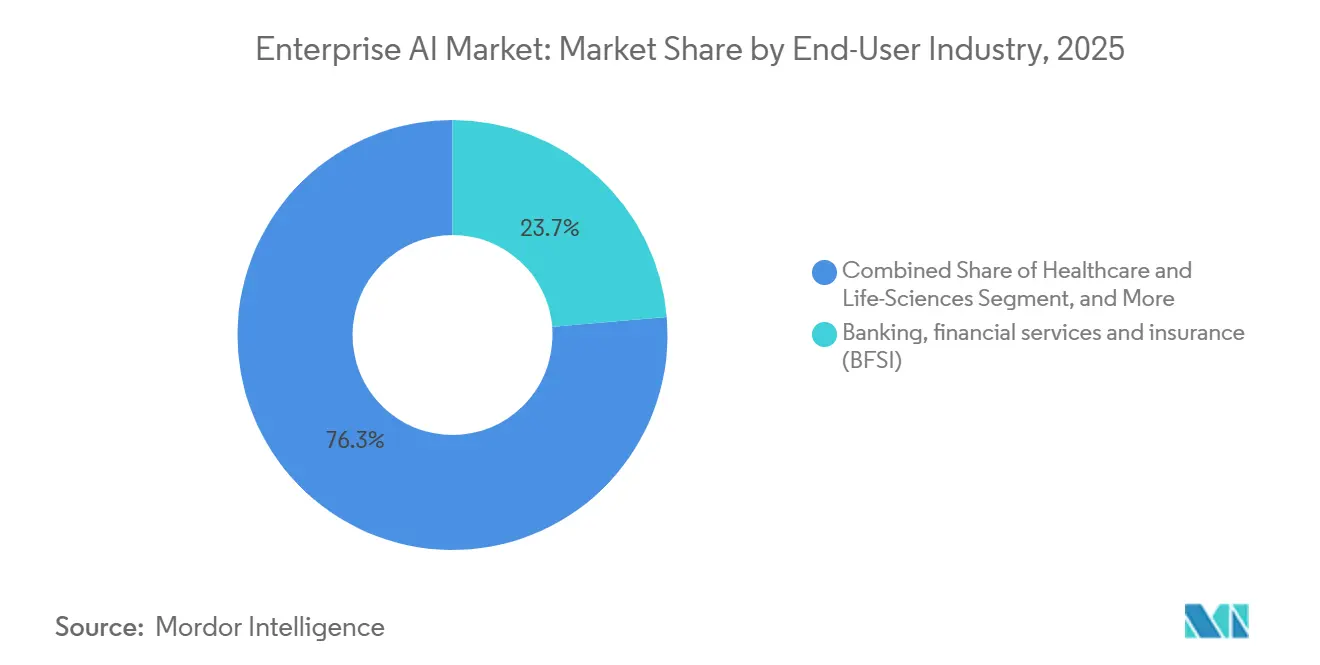
- By end-user industry, banking, financial services, and insurance held 23.67% of the Enterprise AI market share in 2025, while healthcare and life sciences are projected to register a 20.77% CAGR through 2031.
- By deployment model, cloud solutions accounted for 67.33% of 2025 revenue, whereas hybrid and edge configurations are set to grow at a 19.53% CAGR across 2026-2031.
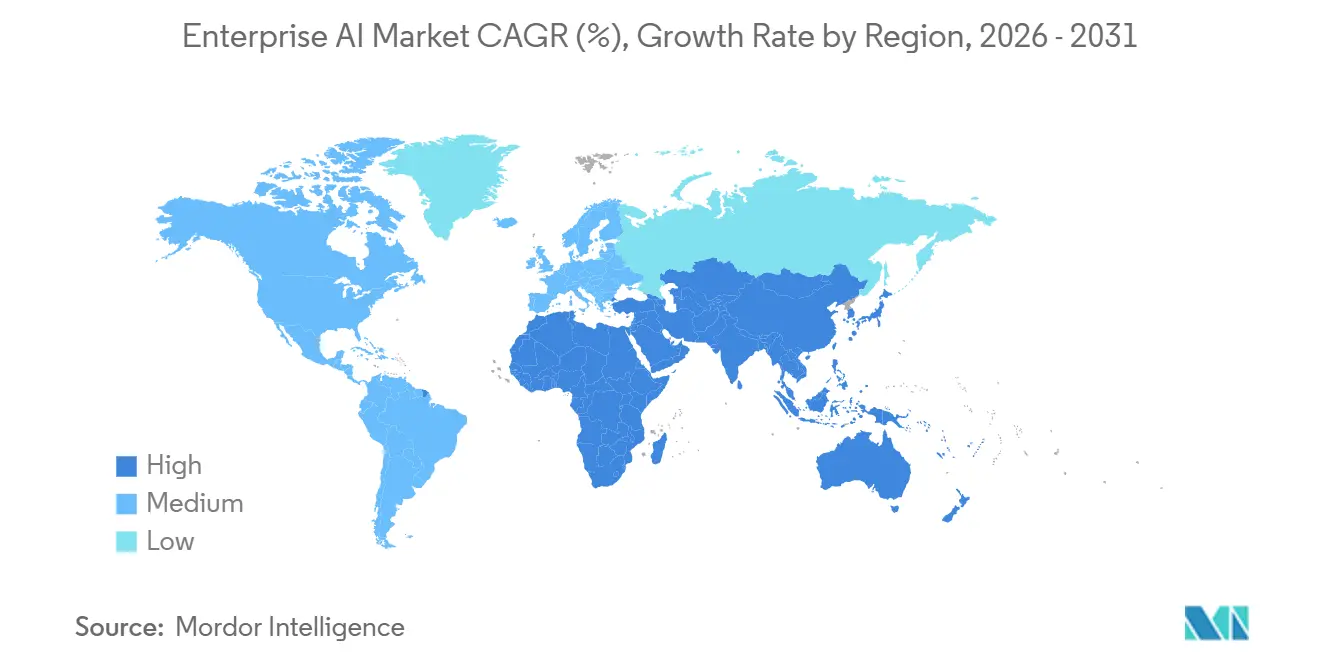
- By geography, North America generated 42.49% of 2025 revenue, while Asia-Pacific is expected to deliver the fastest 19.92% CAGR during the forecast horizon.
Note: Market size and forecast figures in this report are generated using Mordor Intelligence’s proprietary estimation framework, updated with the latest available data and insights as of January 2026.
Global Enterprise AI Market Trends and Insights
Drivers Impact Analysis
| Driver | (~) % Impact on CAGR Forecast | Geographic Relevance | Impact Timeline |
|---|---|---|---|
| Surging demand for automation and AI-based solutions | +4.2% | Global, concentrated in North America and Europe | Short term (≤ 2 years) |
| Need to analyze exponentially growing enterprise data sets | +3.8% | Global, notably Asia-Pacific and North America | Medium term (2-4 years) |
| Rise of cloud-based AI-as-a-Service platforms | +3.5% | Global, led by North America, expanding in Asia-Pacific | Short term (≤ 2 years) |
| Advances in specialized computing hardware | +2.9% | North America, Europe, and Asia-Pacific | Medium term (2-4 years) |
| Industry-specific foundation models democratizing AI for SMEs | +2.4% | Global, early traction in North America and Europe | Medium term (2-4 years) |
| Net-zero pledges driving AI-enabled carbon-optimization tools | +1.7% | Europe and North America, expanding to Asia-Pacific | Long term (≥ 4 years) |
| Source: Mordor Intelligence | |||
Surging Demand for Automation and AI-Based Solutions
Enterprises are redeploying labor from repetitive tasks toward strategic workstreams by embedding conversational AI in customer support and code-generation models in software engineering. IBM disclosed that its Watson platform processed more than 1 billion enterprise customer interactions in 2024, a 40% increase from 2023.[1]IBM Corporation, “IBM Annual Report 2024,” ibm.com Labor savings strengthen the business case for GPUs and inference clusters that underpin large language models. Unlike prior rule-based automation waves, foundation models handle unstructured email, audio, and contract text, enabling new workflows such as contract review and clinical documentation. As accuracy improves, leadership teams are authorizing AI to execute decisions rather than simply recommend actions. The focus has shifted from cost reduction to revenue enablement, positioning automation as a board-level growth lever.
Need to Analyze Exponentially Growing Enterprise Data Sets
Global data creation is tracking toward 175 zettabytes in 2025, compelling enterprises to adopt AI systems that classify, extract, and act on petabyte-scale repositories. Retailers rely on real-time demand sensing across thousands of SKUs, while manufacturers detect anomalies from millions of IoT sensor signals. Salesforce reported that its Einstein platform analyzed more than 1 trillion customer data points per week in fiscal 2024, powering predictive lead scoring and churn alerts. Classic business intelligence tools cannot parse such high-dimensional inputs, so machine learning models that scale horizontally are now mission-critical. Organizations that monetize data through predictive insights are better positioned to create new revenue streams and streamline working capital.
Rise of Cloud-Based AI-as-a-Service Platforms
Cloud delivery eliminates the capital outlay for on-premises GPU clusters and provides pay-as-you-go access to continually updated foundation models. Microsoft disclosed 50% year-over-year growth for Azure AI services in fiscal 2024 as enterprises embedded generative AI into customer-facing workflows.[2]Microsoft Corporation, “Microsoft Annual Report 2024,” microsoft.com Managed services ensure version control and security patches are handled by the hyperscaler, slashing the total cost of ownership. Continuous retraining on vendor-curated datasets pushes accuracy gains to customers without local engineering effort. The model does introduce switching costs, yet the scalability benefit currently outweighs lock-in concerns for most enterprises. As multi-cloud architectures mature, organizations aim to abstract inference endpoints to hedge vendor risk while retaining cloud economics.
Advances in Specialized Computing Hardware (GPU, TPU, NPU)
General-purpose CPUs cannot meet the parallelism required to train or serve large language models. NVIDIA’s H100 GPU delivered up to 30× the inference throughput of its predecessor in 2024, allowing enterprises to consolidate model serving infrastructure.[3]NVIDIA Corporation, “H100 Tensor Core GPU,” nvidia.com Google’s sixth-generation Trillium TPU achieved 4.7× peak performance over the prior generation, with a roadmap focused on energy efficiency. Enterprises reserve multi-year GPU capacity with cloud providers, while others deploy on-premises clusters to control latency and data residency. AMD’s MI300X has intensified price competition, lowering cost per tera-flop and broadening access to high-end accelerators. Hardware breakthroughs shorten training cycles, enabling quicker iteration on domain-specific models.
Restraints Impact Analysis
| Restraint | (~) % Impact on CAGR Forecast | Geographic Relevance | Impact Timeline |
|---|---|---|---|
| Cultural and skills gap slowing enterprise adoption | -2.1% | Global, particularly Europe and Asia-Pacific | Medium term (2-4 years) |
| Data-sovereignty and privacy-regulation hurdles | -1.8% | Europe, Asia-Pacific, spillover to North America | Short term (≤ 2 years) |
| High implementation and infrastructure costs | -1.5% | Global, more pronounced in emerging markets | Short term (≤ 2 years) |
| Complexity in integrating AI with legacy systems | -1.3% | North America and Europe | Medium term (2-4 years) |
| Source: Mordor Intelligence | |||
Cultural and Skills Gap Slowing Enterprise Adoption
Demand for data scientists, MLOps engineers, and AI ethicists continues to exceed supply, inflating salaries and prolonging hiring cycles. Deloitte’s 2024 survey of 2,800 executives revealed that 68% cited talent shortages as the primary barrier to scaling AI. Beyond headcount, cultural resistance persists, as employees remain skeptical of algorithmic recommendations that alter daily workflows. Only one-third of workers reported receiving adequate AI upskilling, highlighting misalignment between executive ambition and workforce readiness. Without comprehensive change-management programs, enterprises risk underutilizing expensive AI infrastructure. Skills scarcity also drives services spending, as firms rely on system integrators to fill capability gaps.
Data-Sovereignty and Privacy-Regulation Hurdles
Regulations such as Europe’s AI Act require transparency and conformity assessments for high-risk applications, adding compliance overhead that slows deployment. The Act entered provisional application in 2024 and imposes strict disclosure rules for credit scoring and biometric surveillance. China’s Personal Information Protection Law mandates domestic data storage and security reviews for cross-border transfers, forcing multinational firms to maintain parallel AI stacks. Penalties under GDPR can reach 4% of global revenue, elevating regulatory risk. Smaller enterprises without dedicated legal teams face disproportionate burdens, widening competitive gaps. Vendors that embed governance tooling and privacy-preserving architectures gain preference in regulated sectors.
Segment Analysis
By Component: Platforms Anchor Spending, Hardware Surges
Software and platforms accounted for 65.89% of revenue in 2025, as enterprises favored integrated toolchains that abstract away infrastructure complexity. The Enterprise AI market size for software reached USD 75.6 billion in 2025, underpinned by offerings such as Microsoft Azure AI Studio and Google Vertex AI. Hardware accelerators are forecast to post a 19.39% CAGR through 2031, the fastest among components, reflecting the compute intensity of large-scale inference workloads. Hardware’s growth elevates the Enterprise AI market by expanding total addressable compute capacity and lowering latency thresholds for real-time applications.
Capital intensity is illustrated by NVIDIA, whose fiscal 2024 data center revenue rose 217% to USD 47.5 billion, driven by H100 and Blackwell pre-orders. Cloud providers are locking in multi-year supply commitments to guarantee GPU availability, while enterprises in regulated industries are procuring on-premises clusters to retain data control. Services revenue follows infrastructure complexity, as system integrators manage data engineering, model deployment, and continuous monitoring. The interplay between platforms, hardware, and services underscores a virtuous cycle, better silicon enables richer platforms, which in turn generate services demand.
Note: Segment shares of all individual segments available upon report purchase
By Organization Size: SMEs Accelerate as Barriers Fall
Large enterprises held 71.43% of 2025 revenue thanks to in-house data science talent and the ability to amortize AI investments across global operations. However, SMEs are projected to outpace the broader Enterprise AI market with a 19.34% CAGR through 2031. Pre-trained foundation models embedded in SaaS applications eliminate the need for bespoke model development, enabling mid-market firms to match enterprise-grade capabilities. Salesforce Einstein and UiPath Automation Cloud illustrate how vendors package AI into low-code interfaces accessible to non-technical teams.
The democratization trend narrows the technology gap between global conglomerates and regional challengers. SMEs leverage pay-as-you-go inference endpoints to avoid upfront capex, while marketplace-based fine-tuning services allow domain-specific customization. Large enterprises still dominate custom model development for proprietary use cases such as algorithmic trading, but growth differentials suggest that AI maturity will converge across organization sizes by the decade’s end.
By Functional Area: HR and Talent Emerge as High-Growth Frontier
Customer-facing functions led with 38.91% of 2025 deployments, as chatbots, recommendation engines, and sentiment analytics improved customer experience metrics. The Enterprise AI market size tied to HR applications is set to expand rapidly, reflecting a 19.76% CAGR over 2026-2031 as firms automate resume screening, career pathing, and workforce sentiment analysis. Talent-focused AI systems shorten time-to-hire and reduce attrition by unlocking predictive insights from employee data.
Operations and supply-chain workloads remain foundational, incorporating demand forecasting and predictive maintenance to optimize inventory and asset utilization. Finance, risk, and compliance use cases continue to mature through real-time fraud detection and regulatory reporting. The pivot toward HR underscores a broader evolution, enterprises now view internal productivity gains as equally critical as external revenue drivers.
Note: Segment shares of all individual segments available upon report purchase
By Technology: Decision Intelligence Gains Momentum
Machine learning and foundation models made up 49.77% of 2025 adoption, reflecting widespread use of supervised learning for classification and large language models for text generation. Decision intelligence tools are forecast to grow at a 19.71% CAGR, combining machine learning with optimization algorithms to recommend and execute actions. The Enterprise AI market share for decision intelligence is projected to rise as enterprises automate high-stakes decisions such as network routing and dynamic pricing.
Natural-language processing extends beyond customer chatbots into contract analysis and knowledge management. Computer vision applications proliferate from manufacturing inspection to healthcare diagnostics. The push toward multimodal models that natively handle text, images, and structured data is reducing the need for separate point solutions, streamlining enterprise procurement processes.
By End-User Industry: Healthcare Leads Growth
Banking, financial services, and insurance retained a 23.67% revenue share in 2025 through mature fraud detection and customer analytics deployments. Healthcare and life sciences are set to post the fastest CAGR of 20.77%, propelled by expedited regulatory approvals for AI-enabled diagnostics. The U.S. Food and Drug Administration had cleared more than 600 AI-supported medical devices by 2024. Pharmaceutical companies employ AI to identify drug candidates and optimize clinical trial design, compressing development timelines.
Manufacturing leverages predictive maintenance and quality inspection to increase uptime, while automotive firms invest in autonomous systems to differentiate premium models. Energy and utilities rely on AI for grid optimization and carbon tracking, guided by net-zero commitments. Media, telecommunications, and retail continue to refine personalization engines and ad targeting, illustrating AI’s versatility across verticals.
Note: Segment shares of all individual segments available upon report purchase
By Deployment Model: Hybrid and Edge Move Center Stage
Cloud remained dominant, accounting for 67.33% of 2025 revenue, but hybrid and edge deployments are forecast to grow at a 19.53% CAGR as latency and data residency concerns intensify. The Enterprise AI market size attributable to edge inference is climbing as autonomous vehicles, industrial robots, and fraud detection systems demand sub-second response times. NVIDIA Jetson shipments grew 40% in 2024, evidencing rising edge-compute adoption.
On-premises clusters persist in healthcare, finance, and government sectors, subject to strict sovereignty rules. Hybrid architectures blend cloud training with local inference, enabling continuous model updates without compromising data control. Microsoft Azure Stack exemplifies this approach by extending cloud services to customer datacenters.
Geography Analysis
North America accounted for 42.49% of Enterprise AI market revenue in 2025, as hyperscaler data centers, venture funding, and university research concentrated innovation in the United States and Canada. National AI research institutes feed a robust talent pipeline, while a permissive regulatory environment accelerates time-to-production. Canada’s Vector Institute continues to commercialize academic breakthroughs, and Mexico is emerging as a nearshore location for AI-enabled business-process outsourcing. GPU supply constraints and salary inflation are current headwinds.
Asia-Pacific is projected to deliver the fastest CAGR of 19.92% through 2031, driven by government-backed sovereign AI programs and localized foundation models in China, India, Japan, and South Korea. China’s USD 50 billion national AI plan finances domestic chip fabrication and model development, reducing reliance on foreign suppliers. India’s IndiaAI mission allocates USD 1.2 billion to build indigenous infrastructure and train 500,000 professionals by 2027. Japan subsidizes AI in manufacturing and healthcare, while South Korea pursues leadership in AI semiconductors. Australia exploits AI in mining and financial services, leveraging advanced digital infrastructure.
Europe follows a measured trajectory, balancing innovation with strict governance under the AI Act. Germany, France, and the United Kingdom invest in public-private research hubs such as Fraunhofer Institutes and Station F, respectively. The Middle East and Africa are at an earlier stage of adoption but show momentum in smart city and energy optimization projects spearheaded by the United Arab Emirates and Saudi Arabia. South America, led by Brazil and Argentina, applies AI to precision agriculture and fintech. Infrastructure gaps and skills shortages temper growth in emerging regions, yet targeted investments and localization partnerships create openings for specialized vendors.
Competitive Landscape
The Enterprise AI market is moderately concentrated. Hyperscalers Microsoft, Google, Amazon, and IBM maintain scale advantages by integrating chips, cloud, and foundation models. Specialized vendors such as C3.ai, DataRobot, and UiPath occupy high-value niches, offering domain-specific accelerators and low-code automation. Competitive intensity is rising as cloud leaders acquire point solutions to extend platform stickiness; Oracle’s 2025 acquisition of Cohere exemplifies this consolidation.
Patent activity signals strategic priorities. NVIDIA filed more than 1,200 AI patents in 2024, focused on GPU architecture, while IBM emphasized hybrid cloud AI and federated learning. Vendors compete on responsible AI features, including bias mitigation, explainability dashboards, and carbon efficiency. Disruptors such as Anthropic and Mistral AI differentiate by optimizing safety, interpretability, or multilingual capabilities. Industry clients increasingly evaluate vendors on governance tooling and energy-to-performance ratios, not just model accuracy. Multimodal offerings that fuse text, image, and video processing within a single stack are emerging as the next battleground.
Investment flows highlight the shift toward infrastructure scale. Microsoft committed USD 3 billion to expand its European AI data centers in December 2025 to address regional data residency requirements. NVIDIA’s Blackwell launch promises 2.5× performance gains for language models, sustaining hardware leadership. Amazon’s Bedrock Custom Models empowers enterprises to fine-tune foundation models while retaining intellectual property. These moves underscore a pattern, platform depth coupled with open customization is becoming the dominant go-to-market formula.
Enterprise AI Industry Leaders
Microsoft Corporation
IBM Corporation
Amazon Web Services Inc.
Google LLC
Oracle Corporation
- *Disclaimer: Major Players sorted in no particular order
Recent Industry Developments
- December 2025: Microsoft announced a USD 3 billion expansion of Azure AI infrastructure across Germany and France to meet EU data residency requirements.
- November 2025: NVIDIA introduced the Blackwell GPU architecture, claiming 2.5× inference speed over the H100 for large language models.
- October 2025: Amazon Web Services unveiled Amazon Bedrock Custom Models, letting enterprises fine-tune foundation models on proprietary data and retain weights.
- September 2025: SAP embedded generative AI into S/4HANA to automate financial close, procurement, and supply-chain planning workflows.
Research Methodology Framework and Report Scope
Market Definitions and Key Coverage
Our study defines the enterprise AI market as all software platforms, supporting hardware accelerators, and related services that embed machine learning, natural-language, vision, or agentic capabilities into core business workflows, from data ingestion through inference, across every major industry vertical.
Scope exclusion: consumer-facing AI apps (e.g., personal assistants, gaming bots) and one-off professional-services projects lie outside this boundary.
Segmentation Overview
- By Component
- Software / Platform
- Services
- Hardware Accelerators
- By Organization Size
- Large Enterprise
- Small and Medium Enterprises
- By Functional Area
- Customer-Facing
- Operations and Supply-Chain
- Finance and Risk
- HR and Talent
- By Technology
- Machine Learning / Foundation Models
- Natural-Language Processing
- Computer Vision
- Decision Intelligence / Optimisation
- By End-User Industry
- Banking, financial services and insurance (BFSI)
- Manufacturing
- Automotive and Mobility
- IT and Telecom
- Media and Advertising
- Healthcare and Life-Sciences
- Retail and e-Commerce
- Energy and Utilities
- Other End-User Industries
- By Deployment Model
- On-Premise
- Cloud
- Hybrid / Edge
- By Geography
- North America
- United States
- Canada
- Mexico
- Europe
- Germany
- United Kingdom
- France
- Russia
- Rest of Europe
- Asia-Pacific
- China
- Japan
- India
- South Korea
- Australia
- Rest of Asia-Pacific
- Middle East and Africa
- Middle East
- Saudi Arabia
- United Arab Emirates
- Rest of Middle East
- Africa
- South Africa
- Egypt
- Rest of Africa
- Middle East
- South America
- Brazil
- Argentina
- Rest of South America
- North America
Detailed Research Methodology and Data Validation
Primary Research
We validate secondary cues through structured interviews with cloud-provider product leads, enterprise-software architects, chief data officers, and systems-integrator executives across North America, Europe, Asia-Pacific, and the Gulf. Surveys of mid-market IT buyers help calibrate spending thresholds and deployment timelines, ensuring assumptions mirror on-ground realities.
Desk Research
Mordor analysts collect foundational signals from publicly available tier-1 sources such as the U.S. Bureau of Labor Statistics, Eurostat, UN Comtrade, and national AI policy portals, complemented by trade bodies like the OECD AI Observatory and the World Semiconductor Trade Statistics program. Company 10-Ks, investor decks, and respected media archives accessed through Dow Jones Factiva enrich adoption and pricing insights. Questel patent analytics and Marklines hardware build-outs add technology-diffusion clues. The sources cited illustrate our process; they are not exhaustive.
Market-Sizing & Forecasting
A top-down construct starts with enterprise IT spending pools, which are then filtered through AI penetration rates by industry and deployment model. Select bottom-up checks, sampled average selling price multiplied by accelerator shipments, and license counts from large SaaS vendors close loopbacks. Key variables include GPU unit ASP trajectories, cloud-AI service usage hours, regulated-sector adoption lags, talent-cost curves, and data-sovereignty mandates. Multivariate regression coupled with three-scenario adjustments (base, high, low) projects growth through 2030, while gap patches in hardware roll-ups are bridged with extrapolated shipment data from customs registries.
Data Validation & Update Cycle
Outputs face variance screens, peer review, and anomaly flags before sign-off. Models refresh every twelve months, with expedited revisions after material events such as abrupt GPU price shifts or blockbuster foundation-model launches.
Why Mordor's Enterprise AI Baseline Is Trusted
Published numbers often diverge because firms choose different inclusion rules, forecasting windows, and currency conversions.
Key gap drivers include: some publishers track only AI-enabled software subscriptions, others omit emerging accelerator hardware or professional-service revenue, and a few apply aggressive CAGR uplifts without reconciling to current IT budget shares. Our disciplined scope, dual-path modelling, and annual refresh cadence limit such drift.
Benchmark comparison
| Market Size | Anonymized source | Primary gap driver |
|---|---|---|
| USD 97.20 B | Mordor Intelligence | - |
| USD 31.51 B | Global Consultancy A | software-only scope and higher base-year discounting |
| USD 28.80 B | Industry Association B | excludes hardware accelerators and uses fixed $/user metric |
These comparisons show that, by aligning spend pools with real adoption ratios and validating through supplier roll-ups, Mordor Intelligence delivers a balanced, transparent starting point that decision-makers can retrace and replicate with confidence.
Key Questions Answered in the Report
What is the forecast revenue for the Enterprise AI market in 2031?
The Enterprise AI market is expected to reach USD 273.08 billion by 2031 at an 18.91% CAGR.
Which component segment is growing the fastest?
Hardware accelerators are projected to rise at a 19.39% CAGR as enterprises scale inference workloads.
Why is Asia-Pacific the fastest-growing region?
Government-funded sovereign AI programs and localized foundation models are driving a 19.92% CAGR in Asia-Pacific.
Which functional area shows the highest growth potential?
Human resources and talent applications are poised to expand at a 19.76% CAGR through 2031.
How are regulations influencing vendor selection in Europe?
The AI Act favors compliance-ready vendors that provide transparency, risk classification, and governance tooling.
What hardware trend is reshaping procurement strategies?
Advances in GPUs and TPUs, such as NVIDIA’s H100 and Blackwell architectures, enable higher inference throughput, prompting multi-year capacity reservations.


