
Market Overview
| Study Period | 2019 - 2031 |
|---|---|
| Market Size (2026) | USD 205.38 Billion |
| Market Size (2031) | USD 283.22 Billion |
| Growth Rate (2026 - 2031) | 6.64 % |
| Fastest Growing Market | Middle East and Africa |
| Largest Market | Asia Pacific |
| Market Concentration | Medium |
Major Players *Disclaimer: Major Players sorted in no particular order Image © Mordor Intelligence. Reuse requires attribution under CC BY 4.0. | |
Construction Equipment Market Analysis by Mordor Intelligence
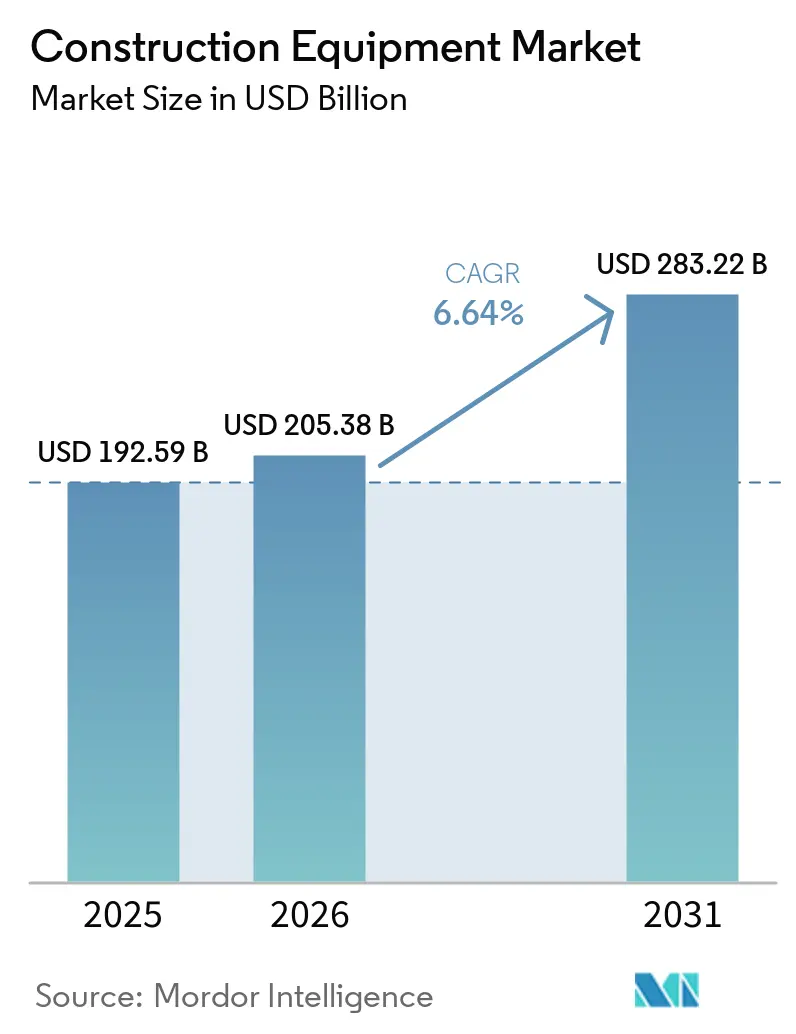
The Construction Equipment Market size is expected to grow from USD 192.59 billion in 2025 to USD 205.38 billion in 2026 and is forecast to reach USD 283.22 billion by 2031 at 6.64% CAGR over 2026-2031.
Robust government spending on roads, rail, power transmission, and semiconductor fabs underpins demand across earthmoving, material-handling, and concrete machinery. Asia’s mega-project pipeline, the electrification push in Europe and North America, and the industry-wide tilt toward rental fleets jointly reinforce a resilient growth outlook. Competitive intensity is sharpening as Chinese OEMs capture share abroad while Western leaders pivot to service-centric offerings and autonomous technologies. The construction equipment market is also shaped by quicker fleet renewal cycles driven by Stage V and EPA Phase 3 regulations, tightening the gap between product and digital service launches.
Key Report Takeaways
- By equipment type, excavators captured 51.24% of the construction equipment market share in 2025, and is expected to grow at a 7.15% CAGR through 2031.
- By propulsion type, internal-combustion engines retained a 90.12% share, while hybrid battery-electric units are set to expand at a 22.16% CAGR, the quickest pace across the construction equipment market.
- By equipment size, heavy machines above 11 tons held around 71.10% of the construction equipment market size in 2025, while compact/mini (less than 6 tons) equipment category is set to register a 14.55% CAGR.
- By power output, sub-250 HP models commanded a 60.85% share, whereas the 250–500 HP band records the highest projected CAGR of 9.62% through 2031.
- By application, infrastructure projects accounted for 73.15% of the construction equipment market share in 2025, whereas mining and quarrying are projected to post a 9.05% CAGR.
- By geography, Asia Pacific led with 45.80% of the construction equipment revenue share in 2025, whereas the Middle East and Africa region is set to register fastest CAGR of 9.12%.
Note: Market size and forecast figures in this report are generated using Mordor Intelligence’s proprietary estimation framework, updated with the latest available data and insights as of 2026.
Market Trends and Insights
Drivers Impact Analysis of Construction Equipment Market*
| Driver | (~) % Impact on CAGR Forecast | Geographic Relevance | Impact Timeline |
|---|---|---|---|
| Mega-Infrastructure Pipelines in Asia | +1.8% | Asia Pacific, Middle East | Medium term (2-4 years) |
| U.S. IRA and CHIPS Acts | +1.2% | North America | Medium term (2-4 years) |
| Rental-First Procurement | +1.1% | Global | Medium term (2-4 years) |
| EU Stage V Caps | +0.9% | Europe | Short term (≤ 2 years) |
| Critical Raw-Material Extraction Surge | +0.7% | Africa | Long term (≥ 4 years) |
| Job-Site Automation | +0.6% | North America, Europe, and advanced Asian markets | Long term (≥ 4 years) |
| Source: Mordor Intelligence | |||
Mega-infrastructure Pipelines Across Asia driving Over USD 2 tn Annual Equipment Demand
A substantial committed project pipeline is reshaping allocation priorities, drawing large dozers, heavy-duty excavators, and high-capacity concrete pumps into Asian depots ahead of other regions. Saudi Arabia recorded a strong increase in project awards, while the UAE reported a sharp rise in awards, reflecting sustained momentum across major infrastructure, energy, and real estate developments. This accelerated project activity is strengthening demand for high-performance machinery that can support complex construction schedules and large-scale site requirements. OEMs are tailoring their sales mixes toward higher-horsepower equipment and longer-reach booms, supporting revenue in the construction equipment market through larger ticket sizes and aftermarket contracts.
U.S. IRA and CHIPS Acts Accelerating Earth-Moving Purchases for On-shoring Projects
Federal incentives for semiconductor fabs, EV plants, and grid upgrades have created a structural pull for 250-500 HP dozers and excavators across the Sun Belt. The American Society of Civil Engineers identifies a USD 3.7 trillion infrastructure gap by 2033, ensuring sustained visibility for OEM order books[1]. Contractors facing labor constraints are increasingly adopting larger units to improve productivity, accelerate project timelines, and lower operating costs. These units help teams complete demanding tasks more efficiently with fewer workers, supporting better resource utilization across job sites.
Rental-first Procurement Shift Among Tier-2 Contractors Expanding Utilization Rates
Rental revenues expected to reach a substantial level, reflecting contractors’ broad preference for off-balance-sheet access to equipment. Utilization rates for connected rental fleets remained notably higher than those for owned machines, as rental providers managed assets more efficiently and improved equipment availability. This trend reinforced a cycle of higher asset utilization, predictive maintenance, and residual value optimization, while also supporting stronger fleet productivity and lower downtime. OEMs realigned their channel strategies by embedding telematics that delivered real-time data to rental partners and supported service contracts.
EU Stage V Emission Caps forcing Rapid Fleet Renewal Toward Hybrid/E-equipment
Stage V regulations now cover lower-power engines and require stricter particulate thresholds. Atlas Copco notes that compliance for compact equipment requires diesel particulate filters, while Perkins reports improved power density in its new Stage V engines. These regulatory changes are increasing the technical requirements for compact and mid-range machinery, prompting manufacturers to reassess engine design, emissions control systems, and powertrain efficiency. This trend accelerates the construction equipment market’s shift toward battery-electric compact loaders and hybrid drivetrains in mid-range excavators.
Restraints Impact Analysis of Construction Equipment Market*
| Restraint | (~) % Impact on CAGR Forecast | Geographic Relevance | Impact Timeline |
|---|---|---|---|
| Hydraulic Component Shortages | -1.1% | Global | Short term (≤ 2 years) |
| Lithium-Ion Cell Scarcity | -0.8% | Global | Short term (≤ 2 years) |
| Persistent Skills Gap | -0.6% | South America, with spillover to Africa | Long term (≥ 4 years) |
| Municipal Noise-Abatement Bylaws | -0.5% | Urban centers in Europe and North America | Medium term (2-4 years) |
| Source: Mordor Intelligence | |||
OEM Lead-time Spikes (Beyond 42 Weeks) Due to Hydraulic Component Shortages
Delivery windows for critical hydraulic valves and pumps remain significantly extended, forcing contractors to adjust project phasing and build greater flexibility into procurement schedules. Market leaders are increasingly pursuing vertical integration to secure supply, as reflected in Caterpillar’s expansion of in-house component machining. Persistent bottlenecks continue to disrupt equipment availability, threaten to defer replacement cycles, and dampen near-term momentum in the construction equipment market until inventories normalize.
Lithium-ion Cell Scarcity Inflating TCO of Electric Heavy Machinery
Heavy-duty battery packs compete with automotive demand, increasing upfront prices for electric excavators compared to diesel counterparts. This price gap can make purchase decisions more challenging for buyers and compress ROI windows, although favorable life-cycle costs continue to support the long-term business case for electrification. OEMs with captive battery supply or strategic joint ventures are better positioned to manage cost pressures, secure component availability, and capture an early share of the electric segment of the construction equipment market.
*Our forecasts treat driver/restraint impacts as directional, not additive. The impact forecasts reflect baseline growth, mix effects, and variable interactions.
Construction Equipment Market Segment Analysis
By Equipment Type:
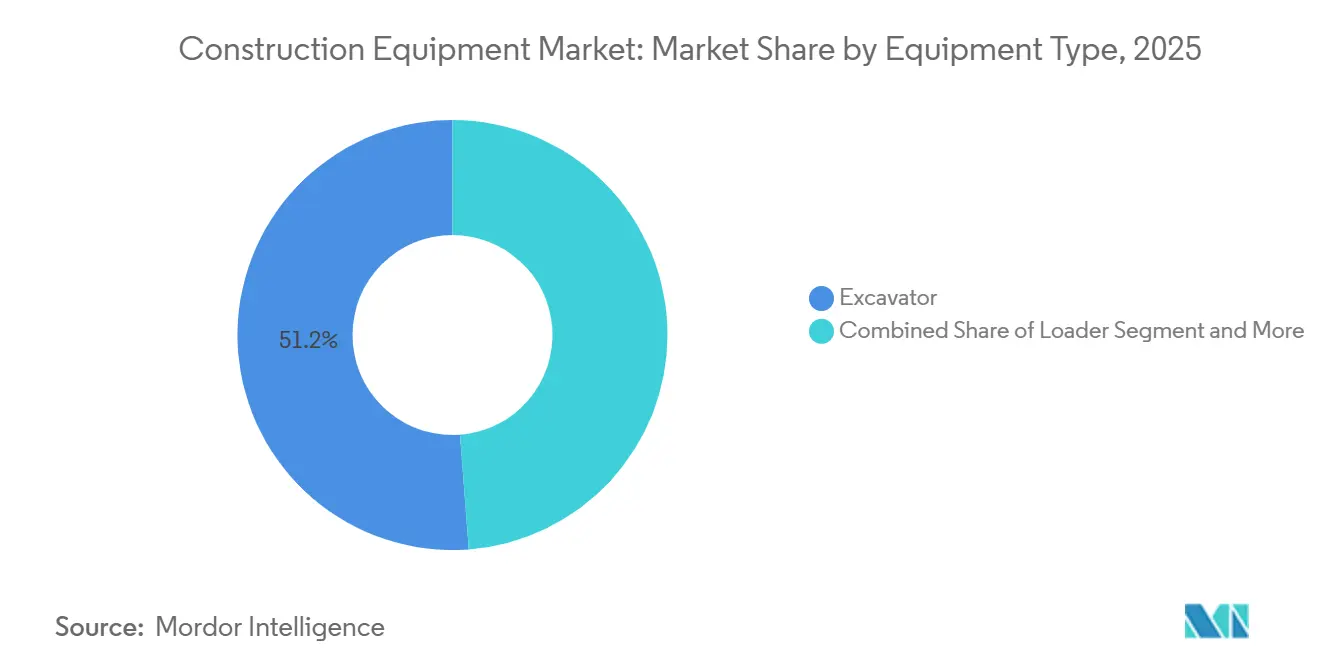
Excavators Anchor Versatility Across ApplicationsExcavators commanded 51.24% construction equipment market share in 2025 and are projected to register a 7.15% CAGR to 2031. Hydraulic efficiency, quick-attach tooling, and telematics integration sustain demand across road-building, utilities, and demolition. Loaders remain second in volume, with wheel loaders favored for paved operations and track loaders for soft terrain. Crane demand follows high-rise and bridge timelines, while graders and rollers maintain road surfaces to millimeter tolerances.
Bulldozers thrive in mining benches where slope stability requires significant drawbar pull, and dump trucks handle hauls beyond 500 meters. Specialty machines, including concrete pumps and trenchers, together hold a significant share of construction equipment market size. Komatsu’s hydrogen-powered prototype signals future fuel diversification, though widespread adoption awaits refueling infrastructure expansion [2].

By Propulsion Type:
Electrification Gains Amid Diesel DominanceInternal combustion units accounted for 90.12% of 2025 shipments, yet hybrids battery electric models will rise at 22.16% CAGR as regulations tighten. Hybrid systems pair smaller diesel engines with batteries, cutting fuel by 25–35% and enabling quiet, zero-tailpipe operation for idling and indoor work. Caterpillar’s 323 electric excavator delivered lower operating costs on grid-connected redevelopment jobs and logged significant orders by end-2025 [3].
Globally, hydrogen fuel-cell rigs are operational in limited numbers, primarily in pilot programs across Japan, Germany, and South Korea. JCB is sidestepping the costs associated with fuel cells, aiming to commercialize its hydrogen combustion engine by 2027. The market for zero-emission construction equipment is closely tied to grid capacity and charging infrastructure. As a result, some buyers are leaning towards hybrids, which offer a diesel fallback until a reliable power source is widely available.
By Equipment Size:
Heavy Gear Dominates While Compact OutpacesHeavy equipment larger than 11 tons captured 71.10% of the construction equipment market share in 2025, fueled by freeway, port, and dam projects that demand 45-ton excavators and 60-ton ADTs. Procurement agencies favor large units to accelerate earthworks and lower per-cubic-meter movement costs.
Compact machines below 6 tons are rising faster, expected to register a 14.55% CAGR as dense cities favor agile skid steers, mini loaders, and zero-tail-swing excavators. Quick-attach couplers and a broadening attachment catalog now allow a single compact base unit to replace multiple dedicated tools, improving job-site economics for small contractors and rental fleets alike. In the compact construction equipment market, high-flow hydraulic options support snow-removal blowers and cold-planer attachments, broadening seasonal use.
By Power Output:
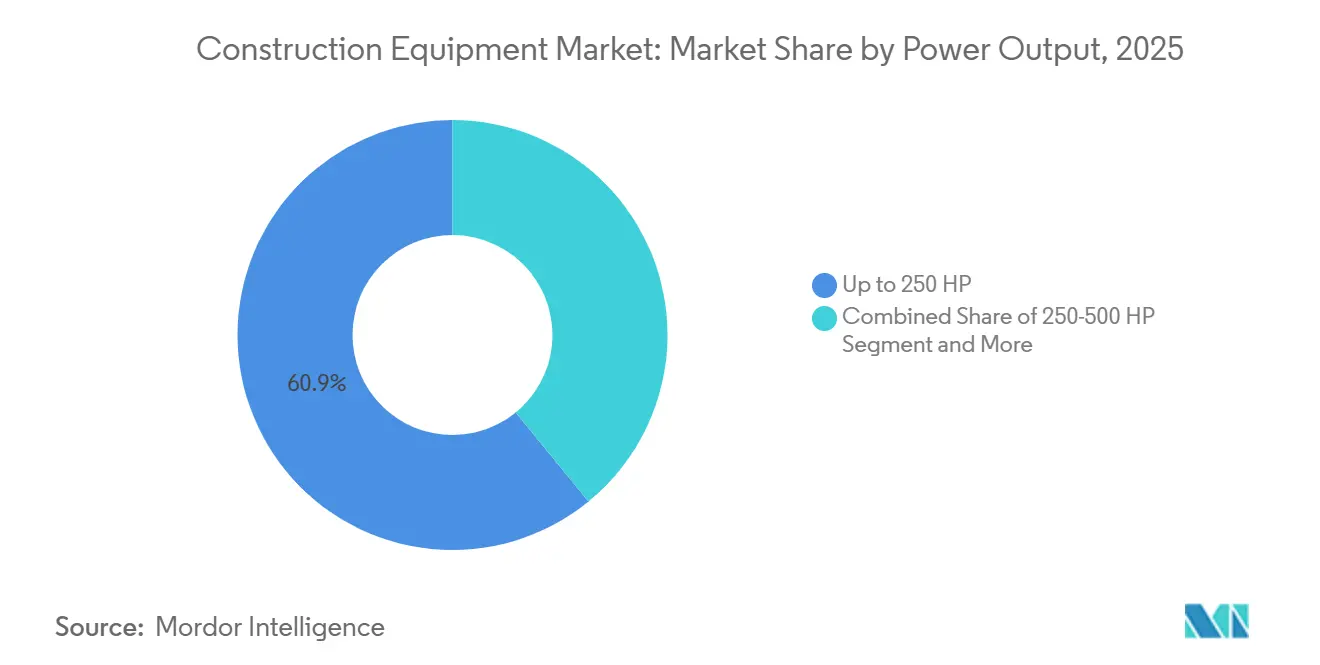
Mid-Range Engines Strike Optimal BalanceMachines up to 250 HP held 60.85% of the construction equipment market size in 2025, balancing fuel economy with sufficient breakout force for mixed-use projects. OEM product roadmaps emphasize modular engine families that scale from 140 HP to 250 HP using common blocks and electronic controls, reducing parts inventory.
The 250-500 HP cohort is forecasted to expand at 9.62% CAGR to 2031, propelled by high-throughput export terminals and mining overburden removal. Advances in aftertreatment design, including compact SCR modules, now enable Tier 4/Stage V compliance without enlarging engine bays, preserving machine geometry. Units above 500 HP occupy a niche yet indispensable role in ultra-large earthworks and open-pit mining, where cycle time gains translate into outsized production benefits.
By Application:
Infrastructure Leads, Mining Emerges FastestInfrastructure projects represented 73.15% of the construction equipment market in 2025 as governments financed bridge refurbishments, rail extensions, and renewable-energy corridors. U.S. federal outlays via the Infrastructure Investment and Jobs Act are funneled toward highways, while Asia focuses on megacity metro lines. Neighboring segments, such as residential and commercial buildings, maintain stable volumes but face cyclical moderation tied to interest-rate regimes.
Mining and quarrying is the fastest-growing application at a 9.05% CAGR to 2031. Demand for copper, lithium, and rare earths vital to energy transition technologies drives multi-billion-dollar pit expansions across Africa and South America. Autonomous haulage and teleremote drilling, once confined to iron-ore majors, are cascading into mid-tier miners, expanding the technology adoption curve in the construction equipment market.
Geography Analysis
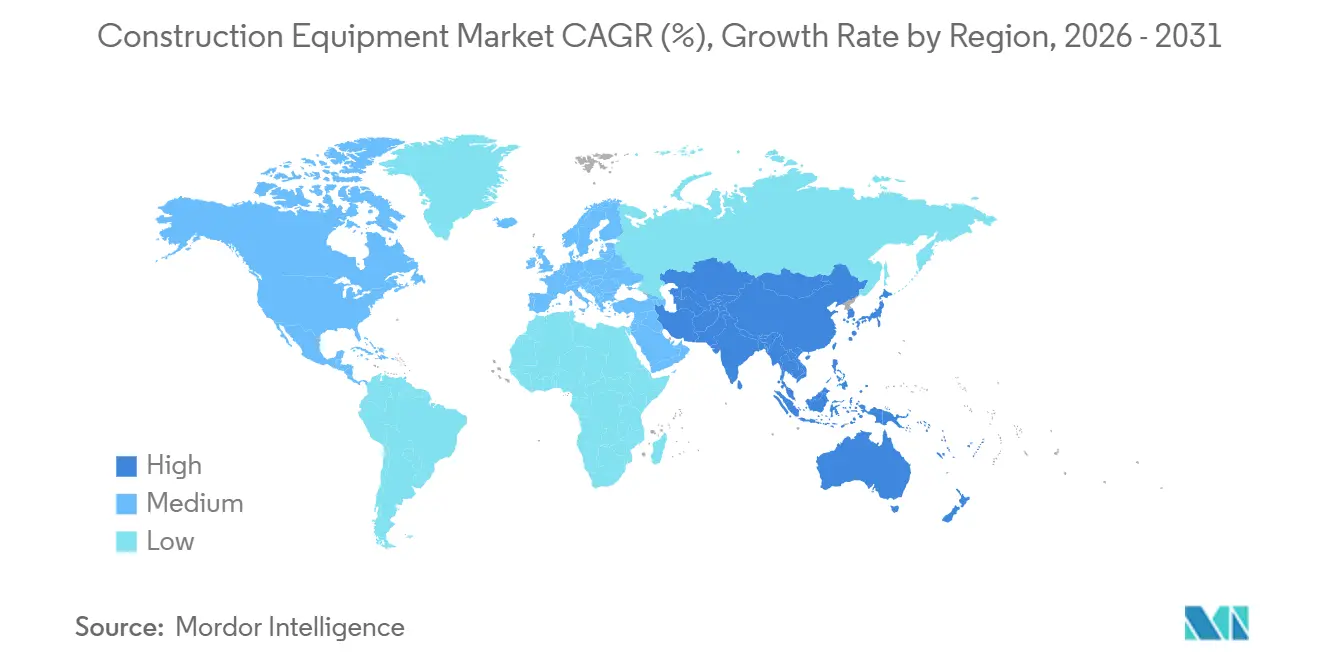
Asia Pacific led with 45.80% of the construction equipment market in 2025, underpinned by China’s Belt and Road Initiative and India’s National Infrastructure Pipeline. Chinese crawler excavator volumes are expected to rise significantly over the coming years, reaching levels well above recent output and strengthening supplier economies of scale. This growth reflects steady demand from infrastructure, construction, and industrial projects across domestic and export markets. Manufacturers are routing high-power diesel inventory to job sites in Southeast Asia and the GCC while shipping compact electric loaders to cities in Japan and South Korea.
The Middle East and Africa posts the fastest trajectory at 9.12% CAGR through 2031 as Saudi Arabia’s Vision 2030 and the UAE’s Dubai Urban Master Plan funnel billions into housing, tourism, and logistics. Project awards jumped significantly in 2024, tightening regional equipment supply and prompting OEMs to stage temporary import yards at Jebel Ali Port. Heat-tolerant battery chemistries and sealed cabin filtration systems are differentiators in the Gulf slice of the construction equipment market.
North America maintains a solid outlook propelled by industrial reshoring and infrastructure revamps backed by the IRA and CHIPS legislation. EPA Phase 3 standards, effective model year 2027, are nudging fleets toward hybrid and electric compact equipment for urban utility work. Rental giants consolidate to secure scale, evidenced by multi-billion-dollar acquisitions that compress dealer networks and elevate access fees.
Competitive Landscape
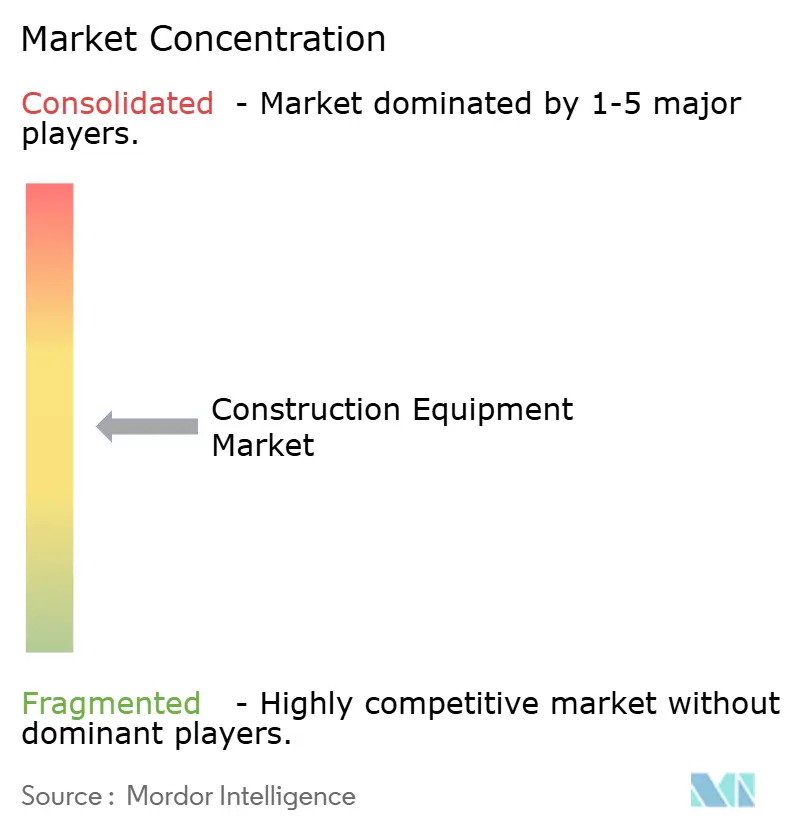
The construction equipment market shows moderate concentration. The top five OEMs, including Caterpillar and Hitachi Construction Machinery, are expected to control a significant share of global shipments in 2025. Competition is intensifying around digital services, autonomous operation, and fuel-agnostic powertrains, rather than pure horsepower. Caterpillar’s shift toward an integrated value chain covering design, logistics, and remanufacturing highlights the market’s transition from equipment sales to lifetime service revenue.
Merger and acquisition activity highlights portfolio realignment. Komatsu’s acquisition of GHH strengthened its underground equipment footprint, while FAYAT’s acquisition of Mecalac expanded its compact equipment offering. Chinese challengers, such as SANY and XCMG, continue to record double-digit export growth, supported by competitive pricing and accelerated electric equipment rollouts. Rental market consolidation, highlighted by Herc Holdings’ and United Rentals’ consecutive purchases of H&E Equipment Services, reduces bargaining fragmentation and increases pressure on OEM discounting.
Product launches reflect the broader electrification and automation trends. Komatsu’s Smart Construction 3D guidance enables full 360-degree bucket rotation and creates digital twins that support progress analytics. Caterpillar’s Stage V telehandlers integrate factory telematics for predictive maintenance, while JCB’s Texas plant expansion signals confidence in sustained US demand. These developments are shifting competitive levers beyond unit sales toward data, uptime guarantees, and circular economy programs.
Construction Equipment Industry Leaders
-
Caterpillar Inc.
-
Komatsu Ltd.
-
Volvo Construction Equipment
-
Deere & Company
-
Hitachi Construction Machinery Co., Ltd.
- *Disclaimer: Major Players sorted in no particular order
Construction Equipment Market Companies Covered in this Report
- Caterpillar Inc.
- Komatsu Ltd.
- Deere & Company
- Hitachi Construction Machinery Co., Ltd.
- Volvo Construction Equipment
- CNH Industrial (CASE, New Holland)
- Liebherr-International AG
- Bobcat Company
- Kobelco Construction Machinery Co., Ltd.
- SANY Group
- Xuzhou Construction Machinery Group Co., Ltd.
- Zoomlion Heavy Industry Science & Technology Co., Ltd.
- JCB Limited
- HD Hyundai Infracore Co., Ltd.
- Terex Corporation
- Astec Industries, Inc.
- Kubota Corporation
- Sumitomo (HSC Cranes)
Recent Industry Developments in Construction Equipment Market
- July 2026: Caterpillar completed the acquisition of Skycatch, a provider of spatial data capture and AI-powered geospatial analysis used in mining and large earthmoving operations. The deal strengthens Caterpillar's technology stack for site digitization and productivity workflows, extending differentiation beyond machine hardware into data-driven services and automation enablers.
- June 2026: Volvo Construction Equipment delivered the first serial-produced A30 Electric articulated haulers to LNS for deployment on the Hafslund hydropower project in Norway. The handover moves battery-electric hauling from prototype activity into early commercial fleet use, giving contractors and OEMs operating references for zero-emission material movement on major infrastructure sites.
- June 2025: Herc Holdings acquired H&E Equipment Services for USD 5.3 billion, accelerating consolidation in the equipment rental channel. A larger combined fleet and footprint increases purchasing leverage and standardizes telematics and service practices, influencing OEM pricing dynamics and aftermarket attach rates.
Construction Equipment Market Report Scope and Research Methodology
Market Definition and Coverage
For this methodology, the construction equipment market is defined as the demand and supply of machines used to execute construction, earthmoving, lifting, hauling, compaction, and related jobsite activities, measured as manufacturer level equipment value in USD across major regions.
Scope exclusions: We exclude standalone jobsite consumables and purely hand-operated tools that are not categorized as construction equipment machines.
Segments Covered in This Report
- By Equipment Type
- Excavator
- Loader
- Mobile Cranes
- Motor Graders
- Bulldozers
- Road Rollers
- Dump Trucks
- Others
- By Propulsion Type
- Internal Combustion
- Hybrid Battery Electric
- Hydrogen Fuel-Cell
- By Equipment Size
- Heavy ( Above 11 tons)
- Medium (6-11 tons)
- Compact/Mini (less than 6 tons)
- By Power Output
- Up to 250 HP
- 250 - 500 HP
- Above 500 HP
- By Application
- Infrastructure
- Residential and Commercial Construction
- Mining and Quarrying
- Oil and Gas/Pipelines
- Industrial and Manufacturing
- Others
- By Geography
- North America
- United States
- Canada
- Rest of North America
- South America
- Brazil
- Argentina
- Rest of South America
- Europe
- Germany
- United Kingdom
- France
- Italy
- Spain
- Sweden
- Rest of Europe
- Asia-Pacific
- China
- India
- Japan
- South Korea
- Indonesia
- Rest of Asia-Pacific
- Middle East and Africa
- Saudi Arabia
- United Arab Emirates
- Turkey
- South Africa
- Nigeria
- Egypt
- Rest of Middle East and Africa
- North America
Data Sources, Market Sizing, and Validation
Desk Research
Desk work starts by building a clean picture of demand signals and supply capacity by geography, then mapping those signals to equipment categories used in construction and adjacent work. We relied on public and official datasets such as national statistics releases on construction output and housing starts, customs trade statistics for machinery categories, and regulators publishing emissions rules that shape replacement cycles, for example EU Stage V and US EPA off-road standards. We also used technical and adoption context from sources such as peer-reviewed journals and patent databases to confirm where electrified or alternative powertrains are becoming practical.
To translate these signals into a usable model, we pulled supporting information from company filings and investor presentations, association and authority websites, and credible press coverage of project pipelines and machine launches. Where needed, paid subscriptions were used only for structured company financials and for shipment and import-export intelligence, mainly to cross-check volumes and pricing bands that were directionally consistent. The desk sources listed here are illustrative and not exhaustive, and additional public references were reviewed to collect data, validate it, and clarify open questions.
Primary Interviews and Surveys
Primary interviews and surveys were used to pressure-test assumptions that are hard to read from public data, such as typical utilization patterns, buying versus rental mix, and price movements by machine class. We spoke with a spread of stakeholders across the value chain, including OEM-facing channel participants, fleet owners and rental firms, contractors, and service providers. We then checked that the themes were consistent across APAC, EMEA, and the Americas.
Distribution of primary research fieldwork respondents
| Company type | Respondent position | Region |
|---|---|---|
| Top tier: 26% | CXOs: 12% | APAC: 44% |
| Mid tier: 60% | Functional/Unit leaders: 39% | EMEA: 34% |
| Smaller Players: 14% | Managers: 49% | Americas: 22% |
Market-Sizing & Forecasting
Sizing starts with a top-down build where construction activity, infrastructure spend signals, and equipment intensity are used to reconstruct the demand pool by region, and then allocated across major equipment classes. The model is anchored on practical inputs, including construction output and project starts, mining and quarrying activity where relevant, equipment replacement cycles influenced by emissions compliance, and the share of rental fleets in total equipment usage. For value sizing, we track average selling price direction by machine size bands and power output ranges, then reconcile it with interview feedback on recent discounting and financing conditions.
After the first pass, results are corroborated with selective bottom-up approximations, including sampled unit volumes multiplied by indicative ASP ranges, and channel checks on shipment trends for high-volume categories, for example excavators, loaders, cranes, graders, rollers, and dump trucks. When gaps appear in country data, we fill them using proxy indicators such as construction output, import dependence, and fleet age patterns, then recheck assumptions with primary inputs. For forecasting, scenario analysis is applied around the most sensitive drivers, mainly construction spending momentum, interest-rate sensitivity of private projects, and the pace of adoption of new propulsion types. The final path is selected based on the consensus direction heard from practitioners.
Data Validation & Update Cycle
Outputs are validated through triangulation across independent signals, and the first checks focus on whether implied unit demand and ASP movement look realistic for each region. Variance checks are then done across adjacent indicators, such as construction activity versus equipment imports, and anomalies are reviewed by another analyst before sign-off. If a number moves outside expected bands, we reopen the underlying assumptions and, when needed, re-contact respondents to confirm what changed in the market.
The report is refreshed annually, and interim updates are made when material events occur, such as policy shifts on emissions, sharp swings in raw material costs that affect pricing, or visible changes in construction pipelines. Before delivery, a final pass is completed so clients receive the latest view that is consistent across the narrative, exhibits, and the market model.
Mordor Intelligence's Construction Equipment Market Estimate Compared With Other Published Estimates
Published market numbers for construction equipment often do not match because each publisher draws the market boundary differently, and then uses different year cutoffs and pricing assumptions to convert units into USD value. The spread can also widen when the forecast path reflects an aggressive or conservative view of construction spending and replacement demand.
Equipment scope and value accounting are usually the biggest gap drivers. Some estimates blend in a broader set of off-highway machines or include services and solutions revenue, which can lift the total even if unit demand is similar. Differences also come from how ASP progression is handled across heavy, medium, and compact equipment, plus whether currency conversion uses an annual average or a point-in-time rate, and how recently the inputs were refreshed.
Benchmark comparison
| Source | Market Size | Gaps in Research Methodology |
|---|---|---|
| Mordor Intelligence | USD 205.38 B (2026) | |
| Global Consultancy A | USD 242.17 B (2025) | Uses a different base year and, based on the scope notes, may apply a broader global revenue framing without the same equipment boundary and category-level unit and pricing cross-checks, which can shift totals upward. |
| Industry Publisher B | USD 258.54 B (2025) | Includes both heavy and compact equipment and also mentions products plus services/solutions, which expands what is counted beyond equipment-only value and can inflate the headline figure versus an equipment sales-only view. |
Construction output signals, import and shipment direction, and category-level unit checks are the evidence used to keep the 2026 value tied to the equipment demand pool in Mordor Intelligence's estimate. When you line up the year, keep equipment-only boundaries consistent, and apply repeatable ASP logic by size and power bands, the range across publishers becomes explainable and easier to use for planning.
Key Questions Answered in the Report
What is the current size of the construction equipment market?
The Construction Equipment Market size is expected to increase from USD 192.59 billion in 2025 to USD 205.38 billion in 2026 and reach USD 283.22 billion by 2031, growing at a CAGR of 6.64% over 2026-2031.
Which region dominates construction equipment demand today?
Asia Pacific leads with 45.80% revenue share, fueled by large-scale infrastructure pipelines in China, India, and GCC countries.
How fast is hybrid battery-electric construction equipment growing?
Hybrid battery-electric models are expanding at a 22.16% CAGR, the fastest of all propulsion types, propelled by stricter emission zones and noise ordinances.
Why are rental channels gaining ground in equipment acquisition?
Rental fleets offer contractors capital flexibility, access to the latest technology, and utilization rates that exceed owned equipment.
Which equipment category holds the largest market share?
Earthmoving machinery, including excavators, loaders, and dozers, held 59.10% of the construction equipment market share in 2025.